Download
1 / 8
80 likes | 154 Views
Investigating the influence of Atmospheric Rivers on snow levels and precipitation in Sierras using data from various sites in California, highlighting the connection between AR events and extreme weather conditions.

E N D
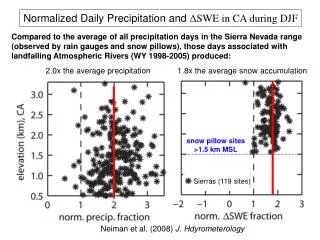
1.8x the average snow accumulation snow pillow sites >1.5 km MSL Sierras (119 sites) Normalized Daily Precipitation and ΔSWE in CA during DJF Compared to the average of all precipitation days in the Sierra Nevada range (observed by rain gauges and snow pillows), those days associated with landfalling Atmospheric Rivers (WY 1998-2005) produced: 2.0x the average precipitation Neiman et al. (2008) J. Hdyrometerology
Four-winter study along northern California coast • Flood-prone Russian River Basin northwest of San Francisco: 2000/01, 2003/04, 2004/05, 2005/06 • Analyses for when the following observing systems were simultaneously operating – (a) Bodega Bay (BBY): GPS-IWV unit, 915-MHz wind profiler, S-band radar, rain gauge (b) Cazadero (CZD): rain gauge • Total rainfall: CZD = 4217 mm, • BBY = 2016 mm • 9548 hourly data points 30 km Upslope flow: orthogonal to the axis of the coastal mtns Neiman et al. (2008), Water Management
Rain >10 mm/h: >12.5 m/s; >2 cm Hourly GPS IWV from BBY (cm) Atmospheric river quadrant: Strongest IWV fluxes yield heaviest rains Hourly 850-1150 m upslope flow from BBY (m s-1)
Bulk Upslope IWV Flux vs. Rainrate Rainrate (mm h-1) CZD BBY GPS IWV (cm) x Upslope flow (m s-1) in the 850-1150 m layer at BBY Rainrate and orographic rain enhancement at CZD increases with increasing bulk upslope IWV flux, i.e., with strengthening AR conditions
AR criteria for case selection: • IWV plumes >2 cm tagged by SSM/I satellites (as in Ralph et al. 2004) crossing BBY. • GPS IWV >2 cm at BBY for at least 8 consecutive hours. • Wind speed >13 m s-1 (~25 kts) at controlling layer (850-1150 m MSL) at BBY. • Results: • 31 AR events with 1859 mm of rain in 386 h. • ARs produced 44% of the observed rainfall in only 21% of the time it rained. • Bulk Rainrate: 4.82 mm h-1 for AR events and 2.28 mm h-1 for all rainfall. • 87% of the 54 hours with rainfall >10 mm/h fell during ARs. 4217 mm 1859 mm (44% of 4-winter rainfall)
Snow levels measured by the S-band radar at CZD during the 4 winters averaged 421 m (1380 ft) higher in AR conditions: Warm conditions & more rain = increased flooding
Brightband snow level at CZD (km MSL) IWV at BBY (cm) • ARs are warm and wet! • Enhanced moisture available to produce extreme precipitation rates • High snow-levels increase the potential for flooding in mountain watersheds