Download
1 / 20
200 likes | 405 Views
Simulation of Hydrodynamics and Solute Transport in the Suwannee River Estuary, Florida. Jerad Bales U.S. Geological Survey Raleigh, NC. Study Objectives. Characterize hydrologic and salinity conditions in Suwannee River Estuary

E N D
Simulation of Hydrodynamics and Solute Transport in the Suwannee River Estuary, Florida Jerad Bales U.S. Geological Survey Raleigh, NC
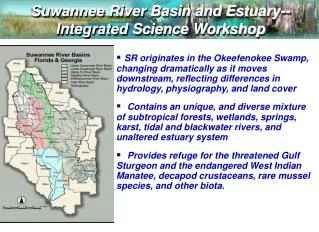
Study Objectives • Characterize hydrologic and salinity conditions in Suwannee River Estuary • Develop, calibrate, and document 3-dimensional unsteady flow and salt transport model. • Provide tool for further applications in Suwannee River Estuary and offshore.
Flow Salinity Water Level 3 km offshore Salinity Water Level Continuous Data Collection in Estuary
0.35 in 2000 compared to 0.45 in 1955 0.27 in 2000 compared to 0.25 in 1955 Flows During Data-Collection Period
WM W5 WP River Fork E6 W8 Buoy #1 W4 W1 W6 W7 G1 7/27/00 10:40 – 11:33
WM W5 WP River Fork E6 W8 Buoy #1 W4 W1 W6 W7 G1 7/27/00 18:35 – 19:54
Suwannee River Estuary Model:A Salinity Prediction Tool • How can the effects of changes in river flow be separated from all of the other factors affecting salinity in the Suwannee? • Data--no experiments --natural variability is great • Statistical techniques--many factors • Computer model--captures most relevant natural processes.
Computational Grid and Boundaries Tidal boundary: Horseshoe Pt. Tides from Cedar Key; Estimated constant salinity Upstream boundary: AGR Measured flow, zero salinity Ocean boundary: ~20 km Tides from Cedar Key, Salinity = 35 psu Depth = 8-9 meters Tidal boundary: Cedar Key Tides from Cedar Key; Estimated constant salinity
Opportunities and Needs • Opportunities with existing model • Evaluate effects of flow changes on salinity distribution (time and space) in estuary and offshore. • Simulate movement of neutrally buoyant material (perhaps larvae?) • Needs • Increased spatial resolution near shore, including tidal creeks, marshes, and offshore reefs. • Ground water inputs. • Better seaward salinity boundary condition • Nutrient transport.
For Additional Information Jerad Bales U.S. Geological Survey jdbales@usgs.gov 919-571-4048
Streamflow Wind Water Level Salinity Velocity Bathymetry Data Collection
Flow distribution on falling tide
Flow distribution on rising tide
EFDC--Rationale for Selection • Scientifically robust. • Public domain--available to SRWMD. • Good documentation. • Supported by EPA. • Used successfully by SJRWMD and SFWMD. • Water-quality simulation capabilities.