Download
1 / 13
130 likes | 155 Views
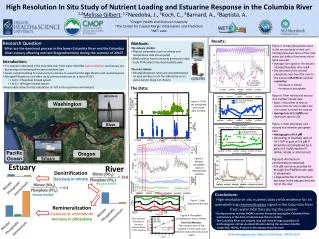
Examining nutrient loading effects on algal biomass in Suwannee River Estuary, focusing on nutrient concentrations, light availability, and hydraulic flushing impact. Investigating spatial and temporal patterns, bioavailable nutrients, and zooplankton grazing effects.

E N D
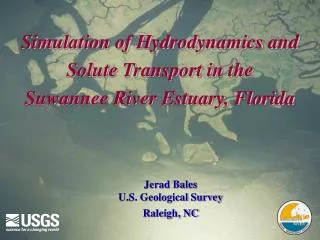
Impact of Nutrient Loading and Hydrodynamics on Algal Biomass in the Suwannee River Estuary Erin Bledsoe and Edward Phlips Department of Fisheries and Aquatic Sciences Institute of Food and Agricultural Sciences University of Florida
High Nutrient Concentrations Short Residence Time Low Light Availability Low Phytoplankton Biomass High Nutrient Potential Estuary D. Hornsby
GOALS: • to determine the relationship between spatial and temporal patterns of nutrient loading and the concentration and distribution of phytoplankton standing crops • Nutrient Loading • Bioavailable Nutrients • Light Availability • Hydraulic Flushing • Macroalgal Distribution and Abundance • Micro-zooplankton Grazing
POTENTIAL LIGHT LIMITATION Average Discharge April 1998 - March 1999 Low Discharge April 1999 - April 2001 Im, Mean Irradiance in the Mixing Zone 2 to 4 mol photon m-2 s-1
ESTIMATED SUWANNEE RIVER LOADING RATES Apalachicola River Neuse River, NC Nitrate SRP
NUTRIENT LIMITATION BIOASSAYS Average Discharge April 1998 - March 1999 Low Discharge April 1999 - April 2001 No Nutrient Limitation N Limitation P Limitation N and P Co-Limitation
MEAN PHYTOPLANKTON BIOMASS Average Discharge April 1998 - March 1999 Low Discharge April 1999 - April 2001 Chlorophyll a (µg chl a L-1) 3 21
FLUSHING RATE IN THE REEF REGION BASED ON RIVERINE DISCHARGE Mean Discharge, 310 m3 s-1
SUMMARY • Meteorological changes in rainfall-related nutrient loading and wind-driven circulation play a significant role in defining the abundance and distribution of phytoplankton in the Suwannee River and its estuary • Light limitation (river region) • Flushing time (river region and reef region) • Nutrient limitation (nearshore region) • Wind-forcing (reef region)
ACKNOWLEDGMENTS Funding : Suwannee River Water Management District Thanks to: Susan BadylakJason Hale Thomas Frazer Mary Cichra Christina Jett Shirley Baker Karen Donnelly Natalie Love Thomas Crisman Jessica Frost-Fajans Beth Sargent Charles Cichra Tammy Grosskopf Michael Quinlan Special thanks to: Rob Mattson and David Hornsby of the Suwannee River Water Management District