Download
1 / 11
120 likes | 307 Views
Phase Reconstruction for Drive Beam Recirculation in the CTF3 Two-Beam Test Stand. CERN Summer Student Presentations 2011 Daniel Xavier Ogburn. CLIC and CTF3. CLIC (Compact Linear Collider) Lepton Collider (e+ e-). High gradient (100MV/m) linear accelerating structures.

E N D
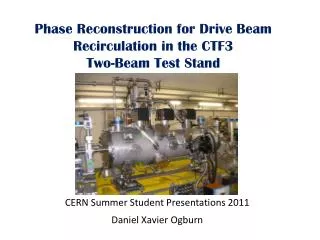
Phase Reconstruction for Drive Beam Recirculation in the CTF3 Two-Beam Test Stand CERN Summer Student Presentations 2011 Daniel Xavier Ogburn
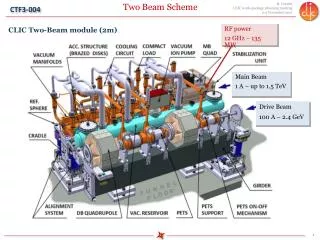
CLIC and CTF3 • CLIC (Compact Linear Collider) • Lepton Collider (e+ e-). • High gradient (100MV/m) linear accelerating structures. • RF Cavities ~ room temperature (not SC). • 12GHz beams with target energy 1.5TeV • Two-beam acceleration . • CTF3 (CLIC Test Facility 3) • Generation of Drive Beam - thermionic gun, 3GHz linac, combiner rings (cf. ‘lemmings’) to reach 12GHz. • Demonstrate two beam acceleration (RF power production in PETS, high gradient acceleration with low breakdown rate). • Study beam stability and dynamics. • Understand physics of RF breakdown (limitations, diagnostics and prevention).
CTF3 and the Two-Beam Test Stand • Beam generation • The CTF3 complex produces a high power, high current (≈32A) drive beam. • Main (‘probe’) beam(≈ 0.9A) is generated by the CALIFES linac. Electron source = photocathode + electric field. • System acts like a giant transformer (cf. Megatron). • TBTS (Two-Beam Test Stand) • Drive beam deceleration and power transfer to Probe beam (via PETS). • RF signals detected by diodes (amplitude) & IQ demodulators (phase info). • - BPM signals detected with 8 electrode inductive • pick up. Faraday cups measure (H/V) position.
Drive Beam and PETS • Power Extraction Transfer Structure • Drive beam enters the PETS recirculation loop. This excites resonant frequencies in the RF cavity which resonates @ beam freq (rel. to e- bunch spacing). • RF waves are launched and extracted from the cavity via waveguides. • Power extracted from Drive beam is transferred to Probe beam. Drive beam decelerated by a few MeV = this generates ~ MW of power. • PETS Recirculaton- As drive beam recirculates through PETS we get a power build up like laser pumping if beam is in phase. Lose power if out of phase.- RF and Beam temporal alignment is a big issue (constructive/destructive interfence). - Power gain is currently ≈ 0.8 to 0.9.
PETS Recirculation Model • AIM: Use phase information from PETS recirculation to optimize beamline parameters in realtime. • Objective: Determine phase shift of drive beam as it circulates through PETS. • Method: Least squares reconstruction using I,Q demodulated RF signals and Beam intensity (current) signals. • We can relate the E-field Emat a given time ‘m’ to the E-field Em-n in the previous loop (‘m-n’) and the beam intensity Im at time ‘m’. The recirculation time is given by ‘n’. • Here gives the round trip gain g & phase shift from the PETS loop. • Coupling between cavity and the beam is represented by Rm=cei(αm+ Ψ) where ei(αm) the arrival phase variation of the beam and c is a beam-cavity coupling constant.
Implementation of Model • Reconstruct the E-field by recording the I,Q demodulated signals coming out of PETS with 250MHz sample rate. Result is complex E-field. • Measure the current (beam intensity) using BPM channels upstream from PETS. These have 192MHz sample rate. • We have a linear system of equations: • Rewrite this in the general least squares form (derived from Variational Inequality and Best Approximation property of a Hilbert Space): • Solve for q and r (assuming r is constant) via LS algorithm (Matlab). • Solve for rm using the LS estimate for q:
Preliminary Issues – Data Acquisition and Processing • BPM and RF pulse acquisition is triggered when breakdown occurs in the RF cavity. Three beam and three RF pulses are recorded (breakdown + two prior pulses). • Synchronization problem. Timestamps have approximately 1 pulse delay between RF and BPM traces (delay varies). Need to put RF and BPM events into 1-1 correspondence. • Issue with timestamp acquisition in control software. • RF is sampled at 250MHz, BPM @ 192MHz. • Have to upsample BPM signals via interpolation routine. Add zeroes to RF sample, align with BPM and then trim (select pulse only). • To temporally align RF and BPM pulses, had to write rising edge selection algorithm. • Noise and missing signals – have to sort through several datasets …
Results (1) – RF and BPM pulse alignment • The I and Q RF signals are approximately aligned with the three drive beam traces (only Q and BPM0 shown here). • Need to try and refine alignment code – use Volker’s Chi-Squared fitting, or try and filter noise out of BPM and RF signals (cleaner data). Maybe numerical integration or ‘data smoothing’ (~ low pass filter) will help.
Results (2) – Phase Reconstruction • For the drive beam pulse duration (0.1 to 0.4 microseconds) the phase appears to decay from ~ 2 radians to 0 radians (with noise and outliers). • Need to analyze a lot more events (which are clean). This means automating the algorithm once we are confident it is doing what it should be.
Forward Strategy and Conclusion • Break down events produce plasma (Cu ions and e-). The plasma interacts with the beam resulting in beam kick, reflections and noise (non-resonant frequencies travelling in beamline). • Do phase reconstruction on good clean data that is relatively free of breakdown. • Sense and Sensibility: Control software needs to be rewritten so that each signal has a designated name as opposed to random assignment + lookup function. Saves hassle and is computationally more efficient. • Real-time phase reconstruction and feedback into control software (to optimize drive beam power gain in the PETS recirculation loop) seems possible if the beam is operating under relatively stable conditions. • Harry is a Cylon.
Acknowledgements • My project supervisors from Uppsala University – Volker Ziemann, Roger Ruber and Andrea Palaia. • The CERN Summer Student Organizers. • The CERN Summer Students.