Download
1 / 40
400 likes | 404 Views
Explore the importance of health and fitness traits in livestock breeding programs and the challenges associated with improving these traits. Learn about the impact of genetic selection and the potential for increased genetic gain. Discover international efforts and guidelines for recording and evaluating health traits. Discuss domestic challenges and opportunities for improving herd health data flow.

E N D
Opportunities for genetic improvement of health and fitness traits
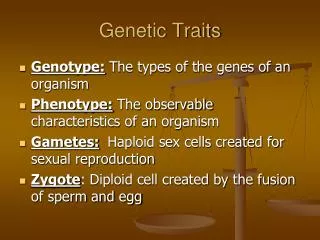
What are health and fitness traits? • Health and fitness traits do not generate revenue, but they are economically important because they impact other traits. • Examples: • Poor fertility increases direct and indirect costs (semen, estrus synchronization, etc.). • Susceptibility to disease results in decreased revenue and increased costs (veterinary care, withheld milk, etc.
Challenges with health and fitness traits • Lack of information • Inconsistent trait definitions • No national database of phenotypes • Low heritabilities • Lots of records are needed for accurate evaluation • Rates of change in genetic improvement programs are low
Why are these traits important? Milk:Feed Price Ratio July 2012 Grain Costs Soybeans: $15.60/bu (€0.46/kg) Corn: $ 7.36/bu (€0.23/kg) Month M:FP = price of 1 kg of milk / price of 1 kg of a 16% protein ration
What does “low heritability” mean? P = G + E • The percentage of total variation attributable to environmental factors is large: • Feeding/nutrition • Housing • Reproductive management • The percentage of total variation attributable to genetics is small. • CA$: 0.07 • DPR: 0.04 • PL: 0.08 • SCS: 0.12
How does genetic selection work? • ΔG = genetic gain each year • reliability = how certain we are about our estimate of an animal’s genetic merit (genomics can ) • selection intensity = how “picky” we are when making mating decisions (management can ) • genetic variance = variation in the population due to genetics (we can’t really change this) • generation interval = time between generations (genomics can )
Ways to increase genetic gain 1Traditional (0.24) and genomic (0.35) reliability for ketosis (Parker Gaddis, 2013, unpublished data). 2Values correspond to culling rates of 10% (0.2), 50% (0.64), and 90% (1.76). 3From the ketosis (0.16) and milk fever (0.44) results of Neuenschwander et al. (2012; Animal 6:571–578). 4Genetic gain relative to the smallest rate of gain (reliability = 0.24, selecion intensity = 0.2).
What are other countries doing? • Scandinavia – Long-term recording and selection program • Canada – Recent work on producer-recorded health event data • Interbull – Limited health traits (clinical mastitis)
International challenges • National datasets often are siloed • Recording standards differ between countries • Many populations are small • Interbullonly evaluates a few health traits (e.g., clinical mastitis)
Functional traits working group • ICAR working group • 7 members from 6 countries • Standards and guidelines for functional traits • Recording schemes • Evaluation procedures • Breeding programs
New and revised ICAR guidelines • Section 16: Recording, Evaluation and Genetic Improvement of Health Traits • Included in the 2012 ICAR Guidelines • New: Recording, Evaluation and Genetic Improvement of Female Fertility • Draft guidelines under review • Section 7: Recording, Evaluation and Genetic Improvement of Udder Health • Currently under revision
2013 ICAR Health Conference • Challenges and benefits of health data recording in the context of food chain quality, management and breeding. • May 30th and 31st in Aarhus, Denmark • 20 speakers from aroundthe world. • Roundtable discussion withindustry leaders.
Domestic challenges • What incentives are there for producers to provide data? • Recording, storage, and transmission of data aren’t free • Will reporting expose producers to liability? • Time versus expectations
Domestic opportunities • Improving health increases profit • Consumers associate better health with better welfare • Not much movement towards a national solution • Nov. 2012 Hoard’s editorial, “Let’s Standardize Our Herd Health Data” • We’ve submitted a follow-up article
What are we doing at AIPL? • Use of producer-recorded health data • Stillbirth in Brown Swiss and Jersey • Gene networks associated with dystocia • Upcoming net merit revision • May add polled to index • Work on calf health led by Minnesota
Path for data flow • AIPL introduced Format 6 in 2008 • Permits reporting of 24 health and management traits • Simple text file • Tested by DRPCs • No data are routinely flowing • Will this change with the new NFCA?
Format 6 records Health Event Segment (19 bytes, 20/record) Herd Identification (31 bytes) Animal Identification (106 bytes) Event date (8 bytes) Event code (4 bytes) Event date type (1 byte) Event detail (6 bytes) (optional, format varies) A three-segment case of clinical mastitis in the right front quarter; the quarter is inflamed but the cow is not sick, and the organism was cultured as Staphylococcus aureus: MAST20041001AFR2R-- MAST20041002AFR2R-- MAST20041004AFR1R--
Potential new data in Format 6 • Traits not in Format 6 • Efficiency and feed intake • Thermotolerance • What about herd-level information? • Housing systems • Rations/nutritional information
Health Event Incidence Lactational incidence rate (LIR) or incidence density (ID) was calculated for each event:
Literature Incidence The red asterisk indicates the mean ID/LIR from the data over all lactations, while the box plots represent the ID/LIR based on literature estimates (data from Parker Gaddis et al.. 2012, J. DairySci. 95:5422–5435).
Variations in incidence rates • Incidence rates in our data are on the low end of those reported in the literature. • Producers may be recording events to denote actions taken, not just observed illness. • Patterns of recording are not constant over time, even within a herd.
Relationships among health events • Logistic regression was used to analyze putative relationships among common health events • Generalized linear model – logistic regression: η = Xβ η = logit of observing health event of interest β= vector of fixed effects (herd, parity, year, breed, season) X= incidence matrix
Genetic Analysis • Estimate heritability for common health events occurring from 1996 to 2012 • Similar editing applied • US records • Parities 1 to 5 • Minimum/maximum constraints • Lactations lasting up to 400 days • Parity considered first versus later
Single Trait Genetic Analyses Sire model using ASReml (Gilmour et al., 2009): η= logit of observing health event of interest β= vector of fixed effects (parity, year-season) X = incidence matrix of fixed effects h = random herd-year effect where h~N(0,Iσh2) s = random sire effect where s~N(0,Aσs2) Zh, Zs= incidence matrix of corresponding random effect
Single Trait Genetic Analyses 1st lactation only Lactations 1 to 5
Single Trait Genetic Analyses Number of sires Health Event
Single Trait Genetic Analyses Lactational Incidence Rate (%) Health Event LIR for 10 worst sires’ daughters LIR for 10 best sires’ daughters
Multiple Trait Genetic Analysis Multiple trait threshold sire model using thrgibbs1f90 (Misztal et al., 2002): λ = unobserved liabilities to disease β= vector of fixed effects (parity, year-season) X = incidence matrix of fixed effects h = random herd-year effect where h~N(0,Iσh2) s = random sire effect where s~N(0,Hσs2) Zh, Zs= incidence matrix of corresponding random effect
Multiple Trait Genetic Analysis • Health traits included in the analysis: • Mastitis • Metritis • Lameness • Retained placenta • Cystic ovaries • Ketosis • Displaced abomasum
Multiple Trait Genetic Analysis Estimated heritabilities (95% HPD) on diagonal and estimated genetic correlations (95% HPD) below diagonal.
Multiple Trait Genomic Analyses • Multiple trait threshold sire model using single step methodology • Used thrgibbs1f90 with genomic options • 50K SNP data available for 7,883 bulls
Multiple Trait Genomic Analyses 2,649sires with 38,416 markers were used in the following model: λ = unobserved liabilities to disease β= vector of fixed effects (parity, year-season) X = incidence matrix of fixed effects h = random herd-year effect where h~N(0,Iσh2) s = random sire effect where s~N(0,Hσs2) Zh, Zs= incidence matrix of corresponding random effect
Multiple Trait Genomic Analyses Select estimated heritabilities (95% HPD) on diagonal and estimated genetic correlations (95% HPD) below diagonal.
What do we do with these PTA? • Focus on diseases that occur frequently enough to observe in most herds • Put them into a selection index • Apply selection for a long time • There are no shortcuts • Collect phenotypes on many daughters • Repeated records of limited value
Conclusions • …
Questions? http://gigaom.com/2012/05/31/t-mobile-pits-its-math-against-verizons-the-loser-common-sense/shutterstock_76826245/