Cause-Effect ~ Total Body Level
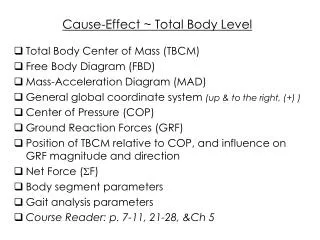
Cause-Effect ~ Total Body Level. Total Body Center of Mass (TBCM) Free Body Diagram (FBD) Mass-Acceleration Diagram (MAD) General global coordinate system (up & to the right, (+) ) Center of Pressure (COP) Ground Reaction Forces (GRF)

Cause-Effect ~ Total Body Level
E N D
Presentation Transcript
Cause-Effect ~ Total Body Level • Total Body Center of Mass (TBCM) • Free Body Diagram (FBD) • Mass-Acceleration Diagram (MAD) • General global coordinate system (up & to the right, (+) ) • Center of Pressure (COP) • Ground Reaction Forces (GRF) • Position of TBCM relative to COP, and influence on GRF magnitude and direction • Net Force (F) • Body segment parameters • Gait analysis parameters • Course Reader: p. 7-11, 21-28, &Ch 5
Balance point of an object Center of an object of uniform density Position is dependent upon relative mass distribution & segment orientation Can be located outside the body During human gait, estimated to be around the hip/pelvis & between base of support (M-L) Position is controlled relative to COP to change the orientation of GRF - dependent upon the mechanical objective of the task Total Body Center of Mass (TBCM)
Glut Max SM/ST ground Draw the FBD for: Forces acting on the runner Forces acting on the ground
F h = m*ah F v = m*av Free Body Diagram (FBD) Mass Acceleration Diagram (MAD) mav mah BW Fh Fv Global Coordinate System
CMx Foot CMx CMx Foot CMx TBCM location is determined by the relative mass distribution and segment orientation • Note any between-athlete differences in: • stance thigh angle; • swing leg position; • trunk orientation; • arm swing position; • that may contribute to the noted difference in CM position relative to COP.
Each Dive Can Be Separated Into Phases, Each with it’s Own Goal Entry preparation Loading Tipping Pushing Flight During the Tipping phase, the center of mass is positioned relative to the feet according to the dive. The position of the CM relative to the force generated during the Push phase will determine rotation (angular momentum) during flight
Controlling shank motion to re-orient TBCM position relative to COP during a “quick first step” “tip” “push” ground Draw the FBD for: Forces acting on the runner Forces acting on the ground
Calculating individual segment CM location Segment CM location coordinates (x, y) Xcm = xprox - (segment length x) * CM% from proximal Ycm = yprox - (segment length y) * CM% from proximal Total Body Center of Mass location coordinates (x, y) X tbcm = (mixi) / TB Mass Y tbcm = (miyi) / TB Mass EX: segment CM calculation
Events - define phases Foot-Strike, Toe-Off Phases - fall between adjacent events (e.g. single support, double support, swing, non-support) Step length (m) Step rate (/s) Walking vs. Running Gait Walking includes double-support phase Running includes flight-phase / non-support phase Average Velocity (SL * SR) Gait Analysis Parameters Walking Gait Running Gait