Download
1 / 29
290 likes | 488 Views
Snapshot of World and U.S. Agricultural Trade Presented to 2009 Southern Outlook Conference Daniel B. Whitley Deputy Director, Trade and Biofuels Analysis Division Foreign Agricultural Service. How Do We Make Official USDA Estimates?. Lock-up process. Input From Multiple Sources.

E N D
Snapshot of World and U.S. Agricultural Trade Presented to 2009 Southern Outlook Conference Daniel B. Whitley Deputy Director, Trade and Biofuels Analysis Division Foreign Agricultural Service
How Do We Make Official USDA Estimates? Lock-up process
InputFrom Multiple Sources • OGA ANALYZES AND EVALUATES MARKET INFORMATION AND DATA FOR CREDIBILITY, RELIABILITY, ACCURACY AND TIMELINESS RemoteSensing Trade Data Vendors World Weather Reports TravelReports AttachéReports OGA Agribusiness OfficialCountry Reports OverseasMedia USDAAgencies(Surveys) EconomicReports Academia
No Coverage Or Staff FAS Regional coverage American In Country 50 FAS Posts Cover 150 Countries Foreign Agricultural Service
OGA Develops Country/Commodity Balance Sheets SUPPLY = DEMAND Ending Stocks Domestic Use Beginning Stocks Production Imports Exports + + = + + Private Area Commercial Feed (On-farm) Yield Concessional FSI (Pipeline) (Food) Government (Seed) (Security) (Industrial) (Public Distribution) (Loss)
FAS Lock-up Commodities • Wheat • Rice • Feed Grains - Corn, Barley, Oats, Sorghum, Rye • Oilseeds - Soybeans, Sunflower, Rapeseed, Peanuts, Palm • Cotton • Meat- Beef, Pork and Poultry • Dairy • Sugar
National Agricultural Statistics Service (NASS) Joint Agricultural Weather Facility Foreign Agricultural Service (FAS) Economic Research Service (ERS) Farm Service Agency (FSA) USDA’s Economic Intelligence System World Agricultural Outlook Board (WAOB)
The Day of Lock-up • Why:Maintain integrity • How often:Monthly, second week • When:2:00 a.m. • Where:Secured wing in South Building • What: • Incorporate NASS domestic estimates • Finalize PSDs and reports • Secretary Vilsack briefed and WASDE report is released at 8:30 a.m., before markets open • FAS reports and databases released at 9:00 a.m.
The Financial Crisis and World Trade The value of global trade contracted in the first half of 2009 compared to last year -30% All Goods By Sector -15% Agricultural Goods -35% Raw Materials -25% Finished Goods
All Goods Plummeted 30% Source: Global Trade Atlas
Agricultural Goods Dropped 15% Source: Global Trade Atlas
Trade Decline Halts($Billions) Source: Global Trade Atlas
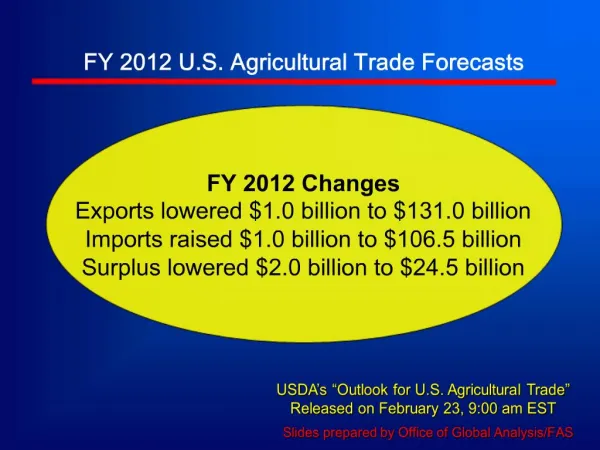
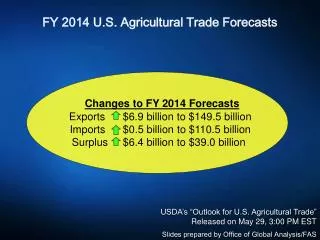
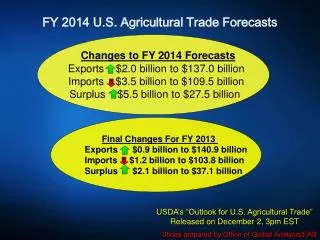
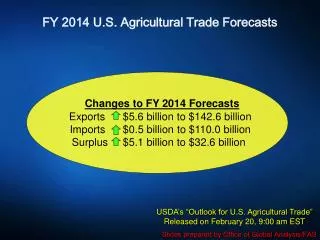
Initial 2010 ForecastAgExports = $97 billionAgImports = $82 billionAgSurplus = $15 billion FY 2009 & 2010 U.S. Trade Forecasts for Agricultural Products Changes Since May in 2009 ForecastAgExports raised $1.5 billion to $97.5 billionAgImports lowered $5.0 billion to $76.0 billionAgSurplus raised $7.5 billion to $21.5 billion USDA’s “Outlook for U.S. Agricultural Trade” Released on August 31, 2009 at 4pm EST Slides prepared by Office of Global Analysis/FAS
U.S. Agricultural Trade Competition in grain, oilseed & cotton markets and global economic recovery shape the 2010 export outlook. Lower grain volumes & prices account for two-thirds of the expected $18-billion export loss in 2009. Imports recover in 2010 after large decline in 2009. 115.3 97.5 97 82.2 Records 79.3 82 76 59.8 49.1 Exports Imports 36 27.3 Trade Surplus 21.5 15
Summary Outlook for FY 2010 AgExportsIncreased Competition in Grain, Oilseed & Cotton Markets Global Economic Recovery Supports High-value Product Sales Bulk exports down $2.7 billion, mostly on weaker prices High-value products up $2.2 billion with generally higher prices for horticultural products and increased meat and soybean oil shipments Grains, Oilseeds & Cotton • Wheat, Coarse Grains & Rice – down a combined $1.3 billion as abundant supplies lower unit value and more than offset any volume gains • Soybeans – exports remain at record volume, but unit value falls on record global production and exportable supply • Cotton – volume falls on smaller US exportable supply & more competition Livestock & Horticultural Products • Red Meats – volumes rise on stronger demand; prices steady to higher • Broiler Meat – volume down on increased competition from Brazil • Horticultural Products – generally higher prices boost export value; record almond stocks with lower prices
U.S. Agricultural Exports By RegionFY 09 to FY 10 Value Change & (region FY 10 percentage of Total U.S. Agricultural Exports) $0(2%) $0(7%) +$800(31%) -$900(31%) -$200(5%) +$100(2%) $0(4%) $0(1%) $0(6%) +$100(3%) $0(1%) -$200(3%)
Top Ag Markets and Ag Suppliers Top Ag Markets… Top Ag Suppliers…
Daniel B. Whitley USDA/FAS/OGA Trade and Biofuels Analysis daniel.whitley@fas.usda.gov (202) 720-0823 Q&A
Export Outlook for Grain & Feed Products Initial FY 2010 Forecast: $25.5 Billion Revised FY 2009 Estimate: $26.4 Billion $800 Million 2010 Key Developments • Coarse grains down $400 mil to $9.6 bil; weakening prices more than offset higher volume • Corn exports up 6 mmt to 53 mmt on greater demand and less competition from Ukraine & Russia • Wheat down $550 million on lower unit values, abundant global supplies, and lower import demand • Rice exports fall $400 mil to $1.8 bil Wild Cards • EU wheat quality • Argentine export policies 2009 Key Developments • Stronger late season corn shipments & higher unit values for rice Includes corn gluten feed/meal Record
Export Outlook for Oilseeds & Products Initial FY 2010 Forecast: $20.1 Billion Revised FY 2009 Estimate: $20.9 Billion $900 Million 2010 Key Developments • Soybean export value down $800 million to $12.9 bil as prices fall in response to record global production & increased exportable supply • Soybean volume unchanged as early season gains offset late year slowdown • Soyoil export volume rises 50% due to diminished S. America availability Wild Cards • Late U.S. plantings/cool weather impact on yields • S. American production rebound • China demand remains key to meeting export forecasts 2009 Key Developments • Strong late season soybean sales to China push volume higher Record Excludes corn gluten feed/meal
Export Outlook for Cotton Initial FY 2010 Forecast: $3.1 Billion Revised FY 2009 Estimate: $3.7 Billion $100 Million 2010 Key Developments • Export volume down 600,000 mt or 20% to 2.2 mmt due to tighter U.S. supplies and intensified competition from carry over stocks in India and Central Asia • Unit values are up on stronger global demand and tighter world stocks Wild Cards • U.S./foreign crops • Global economic recovery 2009 Key Developments • Lower unit value reduces export value despite somewhat higher shipments Record NoteFY ’09 and prior years based on Census data; FY ’10 forecasts based on WASDE MY forecasts
Export Outlook for Dairy, Livestock & Poultry Initial FY 2010 Forecast: $19.7 Billion Revised FY 2009 Estimate: $18.8 Billion $400 Million 2010 Key Developments • Resumption of long term sales growth • Pork up $445 million, beef up $80 million, and dairy up $120 million as improved global economic conditions stimulate demand • Poultry down slightly on competition from Brazil (broilers) and weak turkey demand (Mexico) Wild Cards • Russian TRQ negotiations for meat and poultry • Changes in BSE protocols • Ongoing SPS trade irritants, i.e. China 2009 Key Developments • Pork export value raised slightly on higher unit value Record
Export Outlook for Horticultural Products Initial FY 2010 Forecast: $22.0 Billion Revised FY 2009 Estimate: $21.0 Billion $500 Million 2010 Key Developments • Horticultural products up $1 billion on higher unit values, mainly for processed products • Demand for tree nuts expands in Asia and Europe; record high US almond stocks will help the industry meet foreign demand although unit values are expected lower 2009 Key Developments • Fruits and vegetables, both fresh & processed, reduced $400 million due to short-term contraction in shipments related to economic crisis Record
Imports Resume Growth After FY 2009 Decline FY 2009 imports forecast to fall $3.3 billion to $76 billion FY 2010 imports are forecast at a record $82 billion Observations for FY 2009 • Large decline for imports expected, down $3.3 billion from the previous year; a year-over-year decline is highly unusual. • U.S. consumer spending on food, both domestic and imported product, is forecast to fall 3.7% to $1.07 trillion in CY 2009. Aggregate import volume is forecast to fall less than 1%, but value is down 4% due to price declines for some products. • Consumer spending contracts with negative wealth effect (lower home values and equity market) and soaring unemployment of 9-10%. • Largest declines registered by horticultural and animal products; smaller shipments of live cattle and swine from Canada as inventories decline on poor producer margins due to high feed and energy costs. Observations for FY 2010 • Imports resume growth as consumer spending recovers. • Gains are broad-based across all categories as volumes and prices rise • Sugar imports, which are forecast to rise $700 million in 2009 on higher volume, are expected to rise further on higher prices.
U.S. Exports Plummet FY 2009 Export Forecast Change from FY 2008
Lock-up Week Inter-agency reviews and analyses: