Download
1 / 45
450 likes | 545 Views
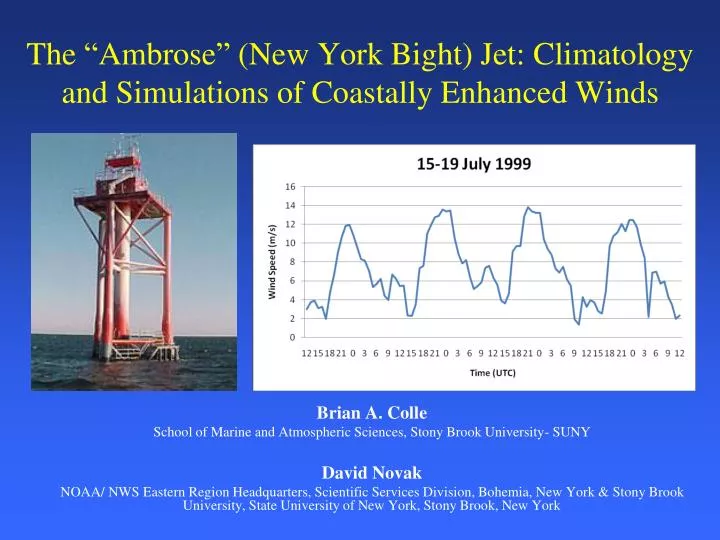
The “Ambrose” (New York Bight) Jet: Climatology and Simulations of Coastally Enhanced Winds. Brian A. Colle School of Marine and Atmospheric Sciences, Stony Brook University- SUNY David Novak

E N D
The “Ambrose” (New York Bight) Jet: Climatology and Simulations of Coastally Enhanced Winds Brian A. Colle School of Marine and Atmospheric Sciences, Stony Brook University- SUNY David Novak NOAA/ NWS Eastern Region Headquarters, Scientific Services Division, Bohemia, New York & Stony Brook University, State University of New York, Stony Brook, New York
15 UTC PK13
23 UTC G24 PK34
Motivation • Jet can result in: • Small craft advisory conditions • Heightened rip current threat • JFK air traffic changes (wind direction, speed, shear)
Study Questions • How frequently does the New York Bight (NYB) Jet occur? • What synoptic conditions favor the NYB Jet? • What dynamics are responsible for the NYB Jet formation and evolution? • Is the NYB Jet predictable?
Analyzed hourly data from Ambrose Light House (ALSN6) during 1997-2006. • Much of 2005 missing – so effective climatology period is nine years. Data • Used logarithmic wind profile eqn. assuming neutral stability conditions to reduce ASLN6 wind to 10 m height.
Direction Range: 160-210 (S-SW) • Timing:Maximum sustained wind recorded in 18-03 UTC period New York Bight Jet Definition • Intensity:one standard deviation over the climatological late afternoon (18 UTC-03 UTC) southerly (160-210) sustained wind max = 11 m/s (~22 kt) • Width:Neighboring Bouy 44025 must have a sustained wind speed < 85% of the ALSN6 sustained wind speed. Condition checked +/- 1 h the time of maximum sustained wind at Ambrose.
134 NYB Jet events recorded in nine year period • Most frequent occurrence in April – July Climatology • Suggests land/sea temperature contrast is important
Compare average monthly NYC temperature max to average monthly ALSN6 sea temperature: Climatology • Temperature differences exceed 5 C during March-Aug. • Suggests land/sea temperature contrast is important
28% of events meet or exceed Small Craft Advisory wind conditions [~13 m/s (25 kt) wind speed] Climatology • Only ~4% of events with wind > ~15 m/s (~30 kt)
Maximum wind in early evening, generally 2-3 h AFTER inland maximum temperature Climatology
Hodograph Light SW wind 8-12 h prior to max. Wind backs to SSE and strengthens 4-8 h prior to max. Wind veers and reaches maximum. Continues veering and weakening over next 12 h. Composite Hodograph T=0 T= +12 T= -12 Red (12 h before max) Blue (12 h after max)
Sequential NYB jet events were often observed • Seven occurrences of 2 consecutive days of events • Three occurrences of 3 consecutive days of events • Two occurrences of 4 consecutive days of events Sequential Events
500 mb Height -- ALL • Dates when the jet started • Graphics created from CPC NARR Composite Page Synoptic Composite 585 MSLP – Small Craft Adv. days MSLP -- ALL 1011 1021 1020
June 2, 2007 • High temperatures around 90 F inland, 70s near the coast. • Ambrose 10 m sustained wind maximized at 25 kt at 22 UTC. Case Study 22Z 12Z
Jet core derived from TDWR was 34 kt at ~70 m (230 ft) ! Case Study
1541 UTC Case Study
Jet derived from ACARS was ~35 kt at ~200 m (600 ft), and found at top of inversion Case Study 2206 UTC
WRFv2.2 • Initialized 00 UTC 2 June (~22 h prior to speed max) • NOGAPS initial/boundary conditions (NAM SST) • YSU PBL • Thermal Diffusion land scheme • 1.33 km resolution w/37 vertical levels Model Simulations • MM5v3.6 • Initialized 00 UTC 2 June (~22 h prior to speed max) • NOGAPS initial/boundary conditions (NAM SST) • Blackadar PBL • Thermal Diffusion land scheme • 1.33 km resolution w/37 vertical levels
Model maximum within 0.5 m/s (1 kt) observed. 1.33-km WRF vs. Obs 22Z 22Z • Similar timing of wind speed and direction, except too much veering after max in model. 12Z 12Z
1200 UTC 1.33-km WRF Forecast • SLP • 100 m wind speed
1500 UTC WRF Forecast • SLP • 100 m wind speed
1800 UTC WRF Forecast • SLP • 100 m wind speed
2100 UTC WRF Forecast • SLP • 100 m wind speed
0000 UTC WRF Forecast • SLP • 100 m wind speed
0300 UTC WRF Forecast • SLP • 100 m wind speed
1000 m 2100 UTC WRF Forecast 800 600 400 Wind Speed (m/s) Theta (K) 200
1000 m 2100 UTC WRF Forecast 800 600 400 Wind Speed (m/s) Theta (K) 200
12 km Does Resolution Matter? 4 km 1.3 km 15 m/s 16 m/s 16 m/s 17 m/s
1.33-km MM5 vs. Obs • Similar evolution, but jet 1-2h and too much veering after max in model. 23Z 23Z 12Z 12Z
Impact of Urban Heating 12Z CTL NOURBAN • Little or no impact from the additional urban heating
Impact of Long Island 12Z CTL NOLI • Jet extends northward, but no further increase in jet strength
Summary • The New York Bight (“Ambrose”) Jet ‘season’ is Mar-Aug, although it can occur any time of the year. • Approximately 15 events per year. • Maximum wind speeds exceed Small Craft Advisory criteria ~ 28% of the time. • Wind Speed Maximum nearly always observed between 21 and 00 UTC. • Serial events common.
Summary (cont.) • Jet favored on warm days in synoptic southwest flow on western flank of Bermuda high. SCA events had slightly stronger gradient and upstream disturbance. • Land/sea temperature contrast appear to be critical to formation. Heating from NYC and Long Island does not enhance jet. • 1.33 km WRF/MM5 capable of simulating key characteristics.