Download
1 / 42
420 likes | 541 Views
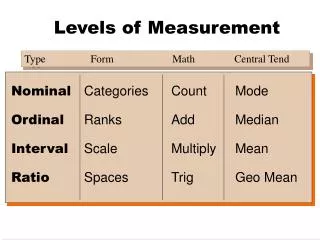
Measurement of e + e - to multihadron cross sections using Initial State Radiation in Babar. Matteo Negrini Frascati, Jan 19, 2006. Outline. The Babar experiment Initial state radiation (ISR) at Babar Multihadron cross sections e + e - p + p - p 0

E N D
Measurement of e+e- to multihadron cross sections using Initial State Radiation in Babar Matteo Negrini Frascati, Jan 19, 2006
Outline • The Babar experiment • Initial state radiation (ISR) at Babar • Multihadron cross sections • e+e- p+p-p0 • e+e- 2(p+p-), p+p-K+K-, 2(K+K-) • e+e- 3(p+p-), 2(p+p-p0), 2(p+p-)K+K- • pp Disclaimer: extensive study of J/y decays in the same channels is not presented here
The PEP-II B-factory 9.0 GeV e- 3.1 GeV e+ ECM=10.58 GeV Peak Luminosity: 1034 cm-2 s-1
The Babar Detector SVT: 97% efficiency 20mm z resolution SVT+DCH: s(pt)/pt=0.13%·pt+0.45% EMC: s(E)/E=2.32%·E-1/4+1.85% 1m
gISR e- hadrons s’ e+ ISR at Y(4S) energy • s of the machine fixed at 10.58 GeV • Radiation of a hard photon s’=0-5 GeV • The gISR is detected in the analysis (acceptance ~10-15%) • Eg ~ 3-5 GeV small fake beam gas background • The hadronic state is collimated on the recoil • Final state radiation contribution small and well separated • s’ determined from the final state • energy resolution depends on tracking • entire energy scan of the cross sections in a single “shot” • m+m- used for luminosity normalization
ISR luminosity ISR cross section for the production of the final state f: x=2Eg/s s’=s(1-x) Probability of ISR photon emission:
Cross section calculation dNfg = number of ISR f events dNmmg = number of ISR mm events dFSR = final state radiation correction (negligible for most f)
e+e-p+p-p0 c2 distribution in the range 1.05<M3p<3 GeV/c2 Selection: • particles inside fiducial volume • Eg>3 GeV for at least one g • kinematic fit applied • fit c2 used for event selection Backgrounds: • p+p-p0p0, p+p-, K+K-p0, t+t-, ... Bkg suppression cuts (improve S/B) • no track identified as K • Ep0>0.4 GeV • kinematical fit to 4p (to reject p+p-2p0) • Mpg>1.5 GeV/c2 (to reject tt) Prel. selection (data/MC) p+p-p0p0 other bkg processes Selected Bkg/efficiency study 89 fb-1 PRD 70, 072004 (2004)
e+e-p+p-p0 Inconsistent with DM2 SND Babar DM2 w’’ M=1350±28 GeV/c2 G=450±100 GeV/c2 w’ w M=1660±10 GeV/c2 G=230±36 GeV/c2 f
Systematic uncertainties e = efficiency eMC = eff. measured on MC d = correction
e+e- 4h p+p-p+p- K+K-p+p- K+K-K+K- Selection: • particles inside fiducial volume • Eg>3 GeV for at least one g • 4 charged tracks • kinematical fits applied • 4p always applied • 2p2K and 4K applied if K are present • fit c2 used for event selection Background: • ISR t+t- and multihadron Separation of different channels based on the c2 for the different kinematical fit 4p candidates 4p MC Non ISR bkg (JETSET) 89 fb-1 PRD 71, 052001 (2005)
e+e- p+p-p+p- Signal Signal region (MC) ISR background (control region) Control region (MC) Non ISR background (JETSET) Selection efficiency vs mass (MC) <1% 3-5% 10% Syst. error due to bkg subtraction
e+e- p+p-p+p- Comparison with previous experiments Measured 4p cross section Only statistical error shown
e+e- p+p-K+K- c2(2p2K)<20 c2(4p)>30 c2(4K)>20 0.5% 4p contamination negligible 4K contamination • 15% systematic uncertainty • Dominated by: • 10% uncertainty in the acceptance (MC) • 5% difference data/MC in K ID Only statistical error shown
e+e- p+p-K+K- 2p2K channel dominated by intermediate K*0Kp After removing events in K*0 bands f K*0(892) r “Other” Kp combination
e+e- K+K-K+K- c2(4K)<20 high purity sample • 25% systematic uncertainty • Contributions: • absence of detailed model for acceptance • uncertainty in bkg subtraction • difference data/MC in K ID Only statistical error shown
e+e- 6h 3(p+p-) 2(p+p-)p0p0 K+K-2(p+p-) Selection: • particles inside fiducial volume • Eg>3 GeV for at least one g • 6 tracks or 4 tracks and 4g (Eg>20 MeV) • kinematical fits applied • fit c2 used for event selection Background: • ISR t+t- and multihadron 232 fb-1
e+e- 3(p+p-) Signal ISR background (control region) Signal region (MC) Non ISR background (JETSET) Control region (MC) Selection efficiency vs mass (MC) <3% 3-5% Syst. error due to bkg subtraction
e+e- 3(p+p-) Intermediate state r0(770)2(p+p-) assumed in MC production All pions point = data histogram = MC
e+e- 3(p+p-) r0(770)2(p+p-) model gives a very good description of the data No other significant structures observed (but full partial wave analysis not done) A 6p phase space simulation does not produce deviations in the angular distribution The acceptance varies by less than 3%, which is taken as a systematic uncertainty MC (J/y not included) Data
e+e- 3(p+p-) Structure at 1.9 GeV also seen by FOCUS FOCUS collab. PLB 514, 240 (2001) Only statistical error shown
e+e- 2(p+p- p0) • Additional bkg reduction cuts: • require Eg>50 MeV • K veto on tracks Structure at 1.9 GeV confirmed in 2(p+p-p0) Only statistical error shown
e+e- 2(p+p- p0) Data MC Presence of resonant structures w r+ J/y w h w r0 f0 p+p-p0 mass “other” p+p-p0 mass Evidence of wh production
e+e- 2(p+p- p0) Structure in wh channel Fit to resonance: m=1.645±0.008 GeV/c2 G=0.114±0.014 GeV/c2 peak cross section=3.08±0.33 nb 2(p+p-p0) wp+p-p0 f(1680) ? w(1650) ? wh
Combining the 6p channels Fit to Breit-Wigner structure by several states decaying to the same mode Continuum Resonance m = 1.88±0.03 GeV/c2 G = 0.13±0.03 GeV f = 21±40˚ m = 1.86±0.02 GeV/c2 G = 0.16±0.02 GeV f = -3±15˚
e+e- 2(p+p-)K+K- • At least one particle identified as K • Kinematical fit • c2(6p)>20 • 15% systematic uncertainty • Dominated by: • 10% uncertainty in the acceptance (MC) • 5% difference data/MC in K ID Only statistical error shown
e+e- pp • Study of: • cross section (continuous spectrum from threshold, s=2mp, in a single measurement) • form factor in the time-like region C = Coulomb correction factor Allows s finite at threshold Experimental challenging because of larger 2-body backgrounds: mm, pp, KK Good PID and kinematical fit required 232 fb-1 hep-ex/0512023
e+e- pp 30% signal loss ISR bkg suppression factors: 15·103 for pp 500·103 for mm 2·103 for KK Selection: • particles inside fiducial volume • Eg>3 GeV for at least one g • 2 charged tracks, both with proton ID • kinematical fit to C+C-g applied • C = e, m, p, K, p 25% signal loss ISR bkg suppression factors: 50 for pp, mm 30 for KK p K p K
e+e- pp 1. ISR backgrounds Background Data ~4000 events N. of bkg events pp 5.9±2.5 KK 2.5±1.0 ee 2.5±1.0 mm <11 K p m
e+e- pp Expected mpp distrib. from ppp0 events 2. pp + photons background Dominant background contribution from ppp0 Kinematical fit to ppgg performed
e+e- pp Detection efficiency 10% systematic error From the difference between pure electric (GM=0) and pure magnetic (GE=0) values
e+e- pp Cross section (systematic error included)
e+e- pp |GE|/|GM| measurement from p angular distribution Two samples of ppg events generated: one with GE=0 the other with GM=0 Angular distributions HM(cosq*,s) and HE(cosq*,s) obtained from the simulation Fit to the distribution: • Free parameters: • A (normalization) • |GE/GM|
e+e- pp Angular distributions for different s regions |GE/GM| measurement from angular distributions (stat. and syst. errors included) GM=0 GE=0
e+e- pp Definition of an “effective form factor” under the assumption |GE|=|GM| Fit to asymptotic behavior At threshold
Summary and perspectives • Extensive ISR analysis program in Babar • Full spectrum from threshold to ~4.5 GeV • All main hadronic channels under study • pp, KK, LL • p+p-2p0, p+p-3p0 • K+K-p0, K+K-2p0, fp0 • p+p-p0h, fh • ...
Systematcs overlook • Luminosity from mm: 3% • Background subtraction: ~1-10% • larger where the cross section is small • Acceptance from simulation: 1-3% • ~10% in some cases (model dependence) • Data/MC differences in tracking/PID: ~3-5%