Download
1 / 27
270 likes | 381 Views
Australia’s Great Barrier Reef Region (GBR) Land based surveys A way forward. Presentation outline. Importance of the GBR region Land Management Practice Survey Pilot Land Account for the GBR Discussion/Questions.

E N D
Australia’s Great Barrier Reef Region(GBR)Land based surveys A way forward
Presentation outline • Importance of the GBR region • Land Management Practice Survey • Pilot Land Account for the GBR • Discussion/Questions
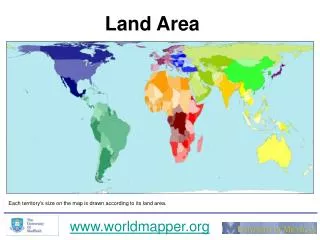
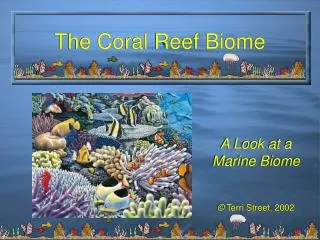
Important Natural AssetWorld Heritage Area with significant biodiversity value
Region that is climatically extreme and under excessive human influences
$200m Australian Government program to improve land management practices
28 River Catchments • 38 million hectares • 790,000 people 15+ • 17,400 farmers and farm managers In 2007-2008 : • $1.7b GVIAP • $4.3b VACP • 1.3 million ML water used
What were the policy questions? • What land management practices were undertaken by farmers in the region? • Could the clients specific issues be measured? • Could the impact of the $200m intervention be measured?
Solving the client’s needs • Business based approach used for Agriculture surveys /census could not produce catchment level information • Solution was to use a land based framework where the ….. • Statistical unit = LAND
Land Management Practices in the Great Barrier Reef Catchments • Collected information from the land owner or manager on a range of land management practices including soil testing, fertiliser and chemical use, water management etc • Survey differs from most ABS surveys about agriculture or land management because it employed a land based methodology rather than a business methodology • Information was collected where the primary land use was classified to: sugar cane, horticulture, broadacre cropping or beef cattle grazing
Collection metrics • Client had different priority needs in each of 28 catchments (beef, sugar, horticulture, broad acre farming) • 50,000 land parcels • 24,000 property identifiers • 19,430 holdings • 4,502 sample (= 23% of pop. & 43% of area) • 92% response rate (= 89% of area)
Statistical Unit • Reported from “holding” - all land parcels under common ownership within an individual catchment • Queensland Valuation and Sales Data (QVAS) and Digital Cadastre Database were used to define spatial land parcel boundaries, and source information about each land parcel including ownership, contact details. • Breakdown of land use was also collected to show area of land used for agriculture (by use) and area of land not used for agricultural purposes (conservation, water use etc)
Interpreting the data • Land management practices with multiple activities (not always possible to say which practice related to which commodity) • Some practices could be carried out multiple times on the one piece of land (area counted multiple times, not = area of holding) • Influence of climatic and other external conditions (eg price, availability of inputs). This could impact on comparison over time • Land used for agricultural activity (grazing) in national parks and state forests was excluded (minimal land management practices allowed)
Percentage of holdings growing sugar cane using hot burn to remove crop residue (trash)
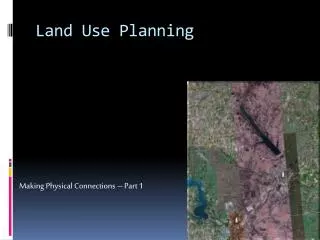
Developing an Experimental Land Account for the Great Barrier Reef Region
What are we doing? • Integrating data from various sources • Statistical • Business Register • ABS collected data • Spatial • Land use • Land value • Land cover • Environmental attributes
What we will be able to do • Produce a set of tables at the Natural Resource Management (river basin) level that will show (using SEEA frameworks) • Land use by sector (from Valuer General) • Hectares • Land value • Land cover by sector (spatial source) • Land use by sector (spatial source) • Change in land cover over time (spatial source)
And we will be able to • Produce small area data (SA1 level) integrating land use and land cover information, as well as other complementary data.
SA1 boundaries (ASGS) • 2,915 SA1’s • 5 NRM regions • 210 land parcels (ave) per SA1
Agencies will be able to overlay their own spatial data files to these layers to produce information for their own policy issues, for example: • Transportation – rail, bus, foot • Salinity • Soil condition • Wildlife mitigation • Social inclusion And build their own regions from the SA1s