
Estimating Proportion of On-Time Airplane Departures
E N D
Presentation Transcript
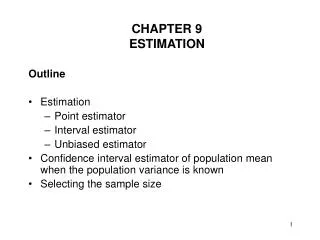
Section 7.3 Estimating p in the Binomial Distribution
Review of theBinomial Distribution • Completely determined by the number of trials (n) and the probability of success (p) in a single trial. • q = 1 – p • If np and nq are both > 5, the binomial distribution can be approximated by the normal distribution.
A Point Estimate for p, the Population Proportion of Successes
For a sample of 500 airplane departures, 370 departed on time. Use this information to estimate the probability that an airplane from the entire population departs on time. We estimate that there is a 74% chance that any given flight will depart on time.
Confidence Interval for p for Large Samples (np and nq > 5) zc = critical value for confidence level c taken from a normal distribution
For a sample of 500 airplane departures, 370 departed on time. Find a 99% confidence interval for the proportion of airplanes that depart on time. Is the use of the normal distribution justified?
For a sample of 500 airplane departures, 370 departed on time. Find a 99% confidence interval for the proportion of airplanes that depart on time. Can we use the normal distribution?
For a sample of 500 airplane departures, 370 departed on time. Find a 99% confidence interval for the proportion of airplanes that depart on time. So the use of the normal distribution is justified.
Out of 500 departures, 370 departed on time. Find a 99% confidence interval.
99% confidence interval for the proportion of airplanes that depart on time: Confidence interval is: We can say with 99% confidence that the population proportion of planes that depart on time is between 0.6895 and 0.7905.
The point estimate and the confidence interval do not depend on the size of the population. The sample size, however, does affect the accuracy of the statistical estimate.
Margin of Error the maximal error of estimate E for a confidence interval
Interpretation of Poll Results The proportion responding in a certain way is
Interpret the following poll results: “ A recent survey of 400 households indicated that 84% of the households surveyed preferred a new breakfast cereal to their previous brand. Chances are 19 out of 20 that if all households had been surveyed, the results would differ by no more than 3.5 percentage points in either direction.”
“Chances are 19 out of 20 …” 19/20 = 0.95 A 95% confidence interval is being used.
“... 84% of the households surveyed preferred …” 84% represents the percentage of households who preferred the new cereal.
“... the results would differ by no more than 3.5 percentage points in either direction.” 3.5% represents the margin of error, E.
The confidence interval is:84% - 3.5% < p < 84% + 3.5%80.5% < p < 87.5% We cay say with 95% confidence that the population proportion of people that would prefer the new cereal is between 80.5% and 87.5%.
Sample Size for Estimating p for the Binomial Distribution Do you have a preliminary study?
Formula for Minimum Sample Size for Estimating p for the Binomial Distribution If p is an estimate of the population proportion,
Formula for Minimum Sample Size for Estimating p for the Binomial Distribution If we have no preliminary estimate for p, the probability is at least c that the point estimate r/n for p will be in error by less than the quantity E if n is at least:
The manager of a furniture store wishes to estimate the proportion of orders delivered by the manufacturer in less than three weeks. She wishes to be 95% sure that her point estimate is in error either way by less than 0.05. Assume no preliminary study is done to estimate p.
She wishes to be 95% sure ... z0.95 = 1.9600
... that her point estimate is in error either way by less than 0.05. E = 0.05
... no preliminary study is done to estimate p. The minimum required sample size would be 385 deliveries to construct a 95% confidence interval for the proportion of deliveries completed within 3 weeks with an error of no more than 0.05 and no preliminary study.
Determine the minimum required sample size if a preliminary study had been conducted. A preliminary estimate of p indicated that p was approximately equal to 0.75:
The minimum required sample size would be 289 deliveries to construct a 95% confidence interval for the proportion of deliveries completed within 3 weeks with an error of no more than 0.05 and a preliminary study indicating that the proportion of deliveries that were completed within 3 weeks was 0.75.