Chapter 8 Estimation
Chapter 8 Estimation. 1. Chapter 8 Estimation. 8.1 Introduction 8.2 Point Estimator of a Population Mean 8.3 Point Estimator of a Population Proportion 8.4 Estimating a Population Variance 8.5 Interval Estimators of the Mean of a Normal Population with Known Population Variance

Chapter 8 Estimation
E N D
Presentation Transcript
Chapter 8 Estimation 8.1 Introduction 8.2 Point Estimator of a Population Mean 8.3 Point Estimator of a Population Proportion 8.4 Estimating a Population Variance 8.5 Interval Estimators of the Mean of a Normal Population with Known Population Variance 8.6 Interval Estimators of the Mean of a Normal Population with Unknown Population Variance 8.7 Interval Estimators of a Population Proportion 2
Introduction • It would not be unusual to see in a daily newspaper that “a recent poll of 1500 randomly chosen Americans indicates that 22 percent of the entire U.S. population is presently dieting(節食), with a margin of error of ±2 percent.” • What exactly does with a margin of error of ±2 percent mean? • How is it possible, in a nation of over 150 million adults, that the proportion of them presently on diets can be ascertained (確定) by a sampling of only 1500 people?
Introduction • Definition An estimatoris a statistic whose value depends on the particular sample drawn. The value of the estimator, called the estimate, is used to predict the value of a population parameter. • For instance, if we want to estimate the mean lifetime of a chip, then we could employ the sample mean as an estimatorof the population mean. • If the value of the sample mean were 122 hours, then theestimateof the population mean would be 122 hours.
Point Estimator of a Population Mean • Definition An estimator whose expected value is equal to the parameter it is estimating is said to be an unbiased estimator of that parameter. • For instance, the sample mean is an unbiased estimator of μ.
Example 8.1 • To estimate the average amount of damages claimed in fires(火災索賠) at medium-size apartment complexes (公寓住宅區), a consumer organization (消費者組織)sampled the files of a large insurance company to come up with the following amounts (in thousands of dollars) for 10 claims: 121, 55, 63, 12, 8, 141, 42, 51, 66, 103 • The estimate of the mean amount of damages claimed in all fires of the type being considered is thus • That is, we estimate that the mean fire damage claim (平均火險索賠) is $66,200.
Point Estimator of a Population Mean • Since a random variable is unlikely to be more than 2 standard deviations away from its mean, we are usually fairly confident that the estimate of the population mean will be correct to within ±2 standard errors.
Example 8.2 • Successive tests for the level of potassium (鉀) in an individual’s blood vary because of the basic imprecision (不精確) of the test and because the actual level itself varies, depending on such things as the amount of food recently eaten and the amount of exertion recently undergone(最近發生的量消耗). • Suppose it is known that, for a given individual, the successive readings of potassium level vary around a mean value μwith a standard deviation of 0.3. • If a set of four readings on a particular individual yields the data 3.6, 3.9, 3.4, 3.5 then the estimate of the mean potassium level of that person is with the standard error of the estimate being equal to • Therefore, we can be quite confident that the actual mean will not differ from 3.6 by more than 0.30 (2 standard errors).
Example 8.2 • Suppose we wanted the estimator to have a standard error of 0.05. • Since this would be a reduction in standard error by a factor of 3, we would have had to choose a sample 9 times as large. • That is, we would have had to take 36 blood potassium readings.
Exercise (p. 336, 10) • Does (a) or (b) yield a more precise estimator of μ? (a) The sample mean of a sample of size n from a population with mean μ and variance σ2 (b) The sample mean of a sample of size 3n from a population with mean μ and variance 2σ2 (c) How large would the sample in (b) have to be in order to match the precision of the estimator in (a)?
Point Estimator of a Population Proportion • Suppose that we are trying to estimate the proportion of a large population that is in favor of a given proposition. • Let pdenote the unknown proportion. • To estimate p, the estimator is an unbiased estimator of p. where and (see Section 7.5)
Example 8.3 • A school district (學區) is trying to determine its students’ reaction to a proposed dress code (服裝規定). • To do so, the school selected a random sample of 50 students and questioned them. • If 20 were in favor of the proposal, then (a) Estimate the proportion of all students who are in favor. (b) Estimate the standard error of the estimate. • Solution (a) The estimate of the proportion of all students who are in favor of the dress code is 20/50 = 0.40. (b) The standard error of the estimate is where pis the actual proportion of the entire population that is in favor. Using the estimate for pof 0.4, the standard error can be estimated by
Exercise (p. 339, 5) • A random sample of 85 students at a large public university revealed that 35 students owned a car that was less than 5 years old. • Estimate the proportion of all students at the university who own a car less than 5 years old. • What is the estimate of the standard error of this estimate?
Example 8.4 • A random sample of nine electronic components (電子元件) produced by a certain company yields the following sizes (in suitable units): 1211, 1224, 1197, 1208, 1220, 1216, 1213, 1198, 1197 • What are the estimates of the population standard deviation and the population variance? • Solution • Since subtracting a constant value from each data point will not affect the value of this statistic, start by subtracting 1200 from each datum to obtain the following transformed data set: 11, 24,−3, 8, 20, 16, 13,−2,−3 • Using a calculator on these transformed data shows that the values of the sample variance and sample standard deviation are S2 = 103 S = 10.149 • Therefore, the respective estimates of the population standard deviation and the population variance are10.149 and 103.
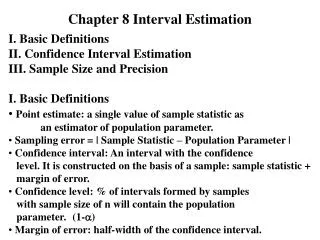
Interval Estimators of the Mean of a Normal Population with Known Population Variance • Definition An interval estimator of a population parameter is an interval that is predicted to contain the parameter. The confidence we ascribe to(把...歸因於) the interval is the probability that it will contain the parameter.
Interval Estimators of the Mean of a Normal Population with Known Population Variance • Let X1, . . . , Xnbe a sample of size nfrom a normal population having known standard deviation σ, and suppose we want to utilize this sample to obtain a 95 percent confidence interval estimator for the population mean μ. • To obtain such an interval, we start with the sample mean , which is the point estimator of μ. has a standard normal distribution. • Since z0.025 = 1.96, 95 percent of the time the absolute value of Z is less than or equal to 1.96 (see Fig. 8.1).
Interval Estimators of the Mean of a Normal Population with Known Population Variance
Interval Estimators of the Mean of a Normal Population with Known Population Variance
Example 8.5 • Suppose that if a signal having intensity μ originates (來源自) at location A, then the intensity recorded at location Bis normally distributed with mean μ and standard deviation 3. • That is, due to “noise,” the intensity recorded differs from the actual intensity of the signal by an amount that is normal with mean 0 and standard deviation 3. • To reduce the error, the same signal is independently recorded 10times. If the successive recorded values are 17, 21, 20, 18, 19, 22, 20, 21, 16, 19 construct a 95 percent confidence interval for μ, the actual intensity. • Solution • The value of the sample mean is
Example 8.5 • Since σ = 3, it follows that a 95 percent confidence interval estimate of μ is given by • That is, we can assert (聲稱)with 95 percent confidence that the actual intensity of the signal lies between 17.44 and 21.16. • A picture of this confidence interval estimate is given in Fig. 8.2.
Interval Estimators of the Mean of a Normal Population with Known Population Variance • We can also consider confidence interval estimators having confidence levels different from 0.95. • For any value of α between 0 and 1, the probability that a standard normal lies in the interval between −zα/2 andzα/2 is equal to 1 − α (Fig. 8.3).
Interval Estimators of the Mean of a Normal Population with Known Population Variance
Example 8.6 • Determine, for the data of Example 8.5, (a) A 90 percent confidence interval estimate of μ (b) A 99 percent confidence interval estimate of μ • Solution
Example 8.6 • Figure 8.4 indicates the 90, 95, and99percent confidence interval estimates of μ. • Note that the larger the confidence coefficient 100(1 − α), the larger the length of this interval.
Interval Estimators of the Mean of a Normal Population with Known Population Variance • Sometimes we are interested in obtaining a 100(1 − α) percent confidence interval whose length is less than or equal to some specified value, and the problem is to choose the appropriate sample size. • For instance, suppose we want to determine an interval of length at most bthat, with 95 percent certainty, contains the population mean. How large a sample is needed? • Note that
Example 8.7 • If the population standard deviation is σ= 2 and we want a 95 percent confidence interval estimate of the mean μ that is of size less than or equal to b = 0.1, how large a sample is needed? • Solution
Interval Estimators of the Mean of a Normal Population with Known Population Variance
Example 8.8 • From past experience it is known that the weights of salmon (鮭魚) grown at a commercial hatchery (孵卵所) are normal with a mean that varies from season to season but with a standard deviation that remains fixed at 0.3 pounds. • If we want to be 90 percent certain that our estimate of the mean weight of a salmon is correct to within ±0.1 pounds, how large a sample is needed? • Solution The length of this confidence interval is less than or equal to 0.2 A sample size of at least 25 is required.
Example 8.9 • To estimate μ, the average nicotine (尼古丁) content of a newly marketed cigarette, 44 of these cigarettes are randomly chosen, and their nicotine contents are determined. • Assume that it is known from past experience that the standard deviation of the nicotine content of a cigarette is equal to 0.7milligrams. (a) If the average nicotine finding is 1.74 milligrams(毫克), what is a 95 percent confidence interval estimator of μ? (b) How large a sample is necessary for the length of the 95 percent confidence interval to be less than or equal to 0.3 milligrams?
Example 8.9 • Solution
Exercises (p. 358, 9, 12) • The standard deviation of the lifetime of a certain type of lightbulb known to equal 100 hours. A sample of 169 such bulbs had an average life of 1350 hours. Find a • 90 percent • 95 percent • 99 percent confidence interval estimate of the mean life of this type of bulb. • A pilot study has revealed that the standard deviation of workers’ monthly earnings in the chemical industry is $180. How large a sample must be chosen to obtain an estimator of the mean salary that, with 90 percent confidence, will be correct to within±$20?
Lower and Upper Confidence Bounds • Sometimes we are interested in making a statement to the effect that a population mean is, with a given degree of confidence, greater than some stated value. • To obtain such a lower confidence boundfor the population mean, use the fact that has a standard normal distribution.
Example 8.10 • Suppose in Example 8.8 that we want to specify a value that, with 95 percent confidence, is less than the average weight of a salmon. • If a sample of 50 salmon yields an average weight of 5.6 pounds, determine this value. • Solution
Example 8.11 • In Example 8.9, find a 95 percent upper confidence bound for μ. • Solution
Exercises (p. 359, 16) • The following are data from a normal population with standard deviation 3: 5, 4, 8, 12, 11, 7, 14, 12, 15, 10 (a) Find a value that, with 95 percent confidence, is larger than the population mean. (b) Find a value that, with 99 percent confidence, is smaller than the population mean.
Interval Estimators of the Mean of A Normal Population with Unknown Population Variance • Suppose that a sample X1, . . . , Xnfrom a normal population has an unknown mean μ and an unknown standard deviation σ, we can use the sample data to obtain an interval estimator of the population mean μ. • The random variable Tn−1 just defined is said to be a trandom variable having n − 1 degrees of freedom.
Interval Estimators of the Mean of A Normal Population with Unknown Population Variance
Interval Estimators of the Mean of A Normal Population with Unknown Population Variance Figure 8.8 depicts the probability density functions of trandom variables for a variety of different degrees of freedom.
Interval Estimators of the Mean of A Normal Population with Unknown Population Variance
Example 8.12 • Find t8,0.05. • Solution
Interval Estimators of the Mean of A Normal Population with Unknown Population Variance
Interval Estimators of the Mean of A Normal Population with Unknown Population Variance
Example 8.13 • The Environmental Protection Agency (EPA環境保護局) is concerned about the amounts of PCB (多氯聯苯), a toxic chemical(有毒的化學物質), in the milk of nursing mothers. • In a sample of 20 women, the amounts (in parts per million) of PCB were as follows: 16, 0, 0, 2, 3, 6, 8, 2, 5, 0, 12, 10, 5, 7, 2, 3, 8, 17, 9, 1 • Use these data to obtain a 95 percent confidence interval of the average amount of PCB in the milk of nursing mothers. • Solution • That is, we can be 95 percent confident that the average amount of PCB in the milk of nursing mothers is between3.42 and 8.18 parts per million.