Download
1 / 31
310 likes | 478 Views
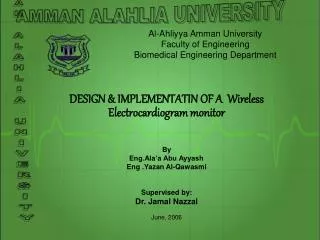
AMMAN ALAHLIA UNIVERSITY. Al-Ahliyya Amman University Faculty of Engineering Biomedical Engineering Department. AMMAN ALAHLIA UNIVERSITY. DESIGN & IMPLEMENTATIN OF A Wireless Electrocardiogram monitor By Eng.Ala’a Abu Ayyash

E N D
AMMAN ALAHLIA UNIVERSITY Al-Ahliyya Amman UniversityFaculty of EngineeringBiomedical Engineering Department AMMAN ALAHLIA UNIVERSITY DESIGN & IMPLEMENTATIN OF A Wireless Electrocardiogram monitor By Eng.Ala’a Abu Ayyash Eng .Yazan Al-Qawasmi Supervised by: Dr. Jamal Nazzal June, 2006
Electrocardiographs • Heart activity causes electrical changes throughout the body, with every heartbeat. • ECG can detect these voltage changes on the skin. • Output is printed in paper or on a computer screen.
INTRODUCTION The electrocardiogram (ECG or EKG) is a noninvasive test that is used to reflect underlying heart conditions by measuring the electrical activity of the heart. By positioning leads (electrical sensing devices) on the body in standardized locations,
INTRODUCTION ECG can be used to : • the rate and regularity of heartbeats • The position of the chambers • the presence of any damage to the heart • effects of drugs and devices used to regulate the heart • provide diagnosis when someone has chest pains or palpitations.
ECG WAVEFORM The QRS complex is where the stronger ventricles fire, pushing blood through the pulmonary artery to the lungs, and through the aorta to the Body.
ECG WAVEFORM • The P wave is seen. This corresponds to both the atrium contracting (depolarizing) and priming the ventricle with blood. • The T wave is the time at which the ventricles repolarize themselves for the next beat
How to detect ECG Waveform Leads are placed on the body in several pre-determined locations, usually the extremities or the front of the chest, to provide information about heart conditions.
PROJECT • For our final project, we implemented a wireless electrocardiogram monitor
INPUT SIGNAL Three leads are placed on the subject – usually one on each side of the chest and on the lower abdomen,This signal is sent to the amplifier .
Amplifier Circuit G=1+50K\RG
Cont.. Amplifier Circuit • Signal is sent to the amplifier where it is amplified by a factor of one thousand. With the reference lead of the subject placed to ground.
Cont.. Amplifier Circuit • Also we can calculate the Gain from this equation G=1+50K\RG By Using a 4.7k resistor, a gain of 11.7 results from this Stage. INA121
Cont.. Amplifier Circuit • Following the instrumentation amp, the signal is passed through two 10 uF capacitors, placed back to back. The capacitors are used to prevent baseline drift in the ECG signal.
VOLTAGE TO FREQUENCY CONVERTER The signal is then sent to the voltage to frequency converter (VFC), which converts the signal to a frequency so that it can be transmitted
Cont.. VOLTAGE TO FREQUENCY CONVERTER • The LM231/LM331 family of voltage-to- frequency converters. • The output when used as a voltage-to- frequency converter is a pulse train at a frequency precisely proportional to the applied input voltage.
TRANSMITTER CIRCUIT • The following schematic describes the source-splitting and transmitter section of our project:
TRANSMITTER CIRCUIT FM transmitter, turning a wire 4 times around the pen allows the signal to be transmitted at 90 MHz.
RECEIVER CIRCUIT • This section consists a summing amplifier with a gain of one cascaded with an inverting amplifier with a gain of approximately two.
RECEIVER CIRCUIT • The summer takes the input obtained from the receiver (a FM radio tuned at approximately 90 MHz) and adds it to a constant voltage obtained using a simple voltage divider.
FREQUENCY TO VOLTAGE CONVERTER The following figure shows the FVC circuit.
FREQUENCY TO VOLTAGE CONVERTER • Equation used to calculated the voltage output due to the frequency response obtained from the LM231 data sheet
RESULT • the output signal is displayed on an oscilloscope
Al-Ahliyya Amman UniversityFaculty of engineeringbiomedical engineering department Special thanks for Dr.Jamal Nazzal Dr.Sameh Al-Sharo Dr. Ousama A’amar By Eng.Ala’a Abu Ayyash Eng.Yazan Al-Qawasmi June, 2006