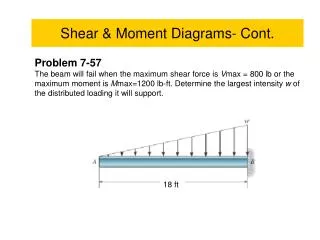
Download

1 / 36
460 likes | 1.11k Views
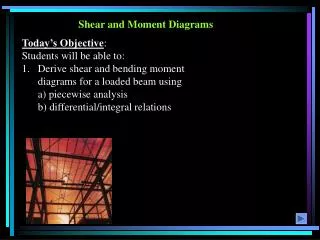
Shear and Bending Moment Diagrams. (Credit for many illustrations is given to McGraw Hill publishers and an array of internet search results). Parallel Reading. Chapter 5 Section 5.1 Section 5.2 Section 5.3 Section 5.4 Section 5.5

E N D
Shear and Bending Moment Diagrams (Credit for many illustrations is given to McGraw Hill publishers and an array ofinternet search results)
Parallel Reading Chapter 5 Section 5.1 Section 5.2 Section 5.3 Section 5.4 Section 5.5 (Do Chapter 5 Reading Assignment Problems)
Beams are One of the Most Important Structural MembersAnd the Load Distribution on them can be Complex This can mean that we have to find our maximum stress loads in order to design beams to handle their task
Shear and Bending Moment Diagrams are One of the Tools we Use to Find Stress Maximums My homework is due When! O Ha Got You!
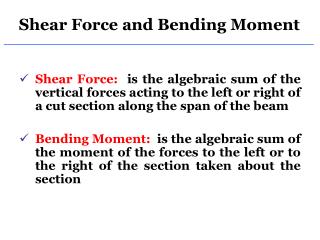
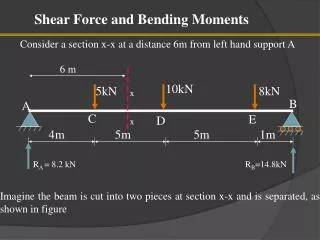
Interesting Fact About Forces on Beam Cross Sections If we slice a beam at any cross section point I bet that is why we like to do shear and bending moment diagrams. We will find shear and bending forces there
Our Mission is to Learn How to Plot the Shear and Moment Down the Length of the Beam V x M x
Sign Conventions Positive Shear Newly Elected Congressman
End Conditions Help us Figure Out Where to Start Simple Support can push and hold in place but cannot apply a moment. Fixed end can supply x and y forces as well as moment Over-hang configuration
Lets Try to Get a Diagram Here is a nice timber beam to work with We can get our reactions at B and D using statics
Two Methods to Get the Diagram We can do statics up and down cross sections Of the beam till we puke.
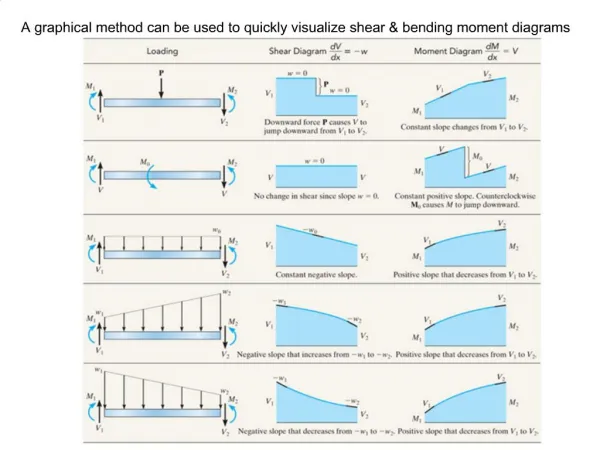
Or There is a Graphical Method Starting with the shear diagram we note that the change in shear is equal to the additional weight added to the next increment. If we go over a 1 foot increment, how much shear will be pick up?
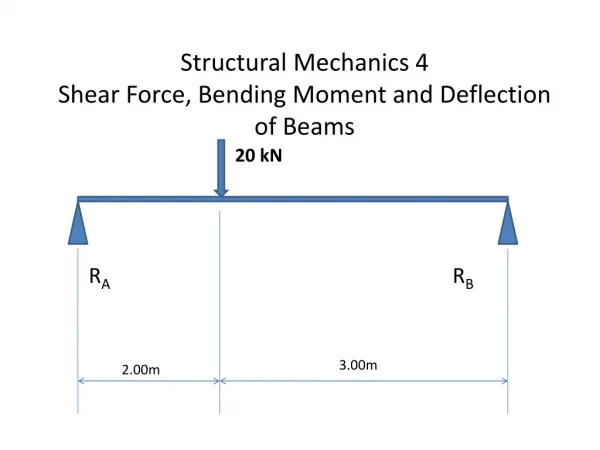
Of Course the Easiest Case is the Jump that Occurs at a Point Load Lets give it a try moving left to right A B V 20 kN
Now What Happens at B? We see a jump up of 46 kN
Now Lets Look at C We take a dip of 40 kN -14 kN
And at D We Come Back the Neutral Move back up By 14 kN
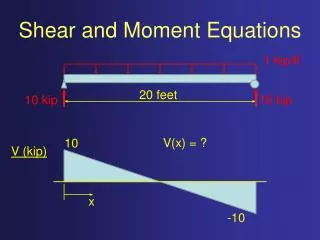
That Last One Wasn’t BadLets Try This One! A evenly distributed load results in a linear slope on the shear diagram.
We Start at the Left with Our Distributed Load 8 ft We accumulate a Shear load of -24 kips
We Note that from C to D there is no change 3 ft Things stay the same till there is change
Now We Have a Point Load at D 5 ft We see a drop of 10 kips at the point load
And Our Reaction at B brings us back to Neutral Point load brings us back up by 34 kips to neutral
Lets Get Even More Exciting We’ll try an unevenly distributed distributed load.
Oh Ya – Like Figuring the Area of a Triangle will Scare Us We draw a curve down to the appropriate value. We know the curve is 2nd order but we don’t have to be big on detail because our critical load point is not going to be on a down sloping curve.
Knowing that We Can Get the Total Change in Shear Load Over an Interval by Integrating Under the Load Curve lets Us Solve for Any Crazy Load Distribution. Integrate this area to get the magnitude of This
Now We Have to Deal With Bending Moment Diagrams A relationship to the rescue
Semi - English TranslationIntegrate the Area of the Shear Diagram to get total Moment Change for the Interval 8 ft 8 ft 6 ft 10 ft Note that we integrated 18 kips over 6 feet (ok you don’t have to integrate to know the area of a rectangle is base X height) To find the area of 108 positive We now use this for the magnitude of the Moment change over that 6 ft.
When the Slope of the Shear Diagram is Zero the Slope of the Moment Diagram is a Straight Line The area of the shear diagram from B to C is -2 kips X 8 ft = -16 kip*ft
Working Out the Next Part of OurMoment Diagram We take the 16 kip*ft away from our old value Of 108 kip*ft and get our new value of Note also that since the shear line Has no slope the drop in moment Is linear. 92 Kip*ft
We Next Drop to -14 kips shear over 10 ft. Integrating that (ok just getting the area of the rectangle on the shear diagram) We get -14 kips * 10 ft = -140 kip*ft
Now We Will Put that -140 kip*ft into the Moment Diagram + 92 kip*ft – 140 kip*ft = -48 kip*ft -48 Again note the Steady sloped line
Our Shear Load Jumps at Point D and then tapers to zero Our triangle has an area of 12 * 8 / 2 = 48 kip*ft Obviously a plus 48 kip*ft Will bring a minus 48 kip*ft to zero
Rules for Shear and Moment Diagrams Concentrated loads produce a jump in the shear diagram and a change in The linear slope of the moment diagram.
Shear and Moment Diagrams An evenly distributed load produces and linear slope in the shear diagram and the value of the shear is the slope of the line in the moment diagram.
Shear and Moment Diagram Rules For an unevenly distributed load the value of the load is the slope of the Line in the shear diagram (and the value shear is the slope of the moment Line)
For Your Sanity You can go nuts trying to get the slope and curve right between two points but it is the value inflextion points on the moment curve that controls design. Get the values at the section end points right and don’t sweat to much about exact values in between. Critical points
Assignment 21 Do problems 5.5-1, 5.5-11, 5.4-14 (yes I know they are out of order)
![Shear Force and Bending Moment Diagrams [SFD & BMD]](https://cdn1.slideserve.com/2511906/shear-force-and-bending-moment-diagrams-sfd-bmd-dt.jpg)


![Shear Force and Bending Moment Diagrams [SFD & BMD]](https://cdn3.slideserve.com/6594612/shear-force-and-bending-moment-diagrams-sfd-bmd-dt.jpg)
![Shear Force and Bending Moment Diagrams [SFD & BMD]](https://cdn5.slideserve.com/9656216/shear-force-and-bending-moment-diagrams-sfd-bmd-dt.jpg)