Download

1 / 50
500 likes | 665 Views
American Public Perception of Mars Mission Economics: Establishing a Proper Context. Brian Enke SwRI Boulder, CO benke@boulder.swri.edu AUTHOR: Shadows of Medusa. GOALS. Put the U.S. investment in manned spaceflight into a proper CONTEXT.

E N D
American Public Perception ofMars Mission Economics:Establishing a Proper Context Brian Enke SwRI Boulder, CO benke@boulder.swri.edu AUTHOR: Shadows of Medusa
GOALS • Put the U.S. investment in manned spaceflight into a proper CONTEXT. • Provide "Take-Home Points" to assist with damage control.
Outline • Public Perception • Baseline Mission • NASA Budget • US Government Budget • US Economic Activity • Public Perception
75% believe the space program is a good investment! Humans-to-Mars favored (49% vs 42%) Conclusion: Many people believe a manned Mars mission would not be a good investment, i.e. too expensive ICR Poll for the Associated Press(7/28/2003)
Quote from a retiree in New Jersey: "We can go there after all the things wrong on Earth are fixed. I'm totally against any of it. It's a total waste of money we need for our kids, for illnesses, could put somebody's kids through college, could cure so many diseases." ICR Poll for the Associated Press(7/28/2003)
Take-Home Point! Health, Education, and Welfare are IMPORTANT investments! We should never advocate reducing the funding for these programs. We don't need to.
76% would increase NASA funding or keep it unchanged 59% believe humans will set foot upon Mars within 25 years! (18% < 10 years) Zogby International - Research Poll(7/3/03)
83% believe a manned space program is important! HOWEVER...... 24% believe the US should end its manned space program altogether Zogby International - Research Poll(7/3/03)
Less than 1% 1% to 5% 5% to 10% More than 10% Not sure Zogby International - Research Poll(7/3/03) Question 2: What percentage of the federal budget do you think is spent each year on the nation's manned and unmanned space programs?
Less than 1% 20% 1% to 5% 37% 5% to 10% 19% More than 10% 17% Not sure 8% Zogby International - Research Poll(7/3/03) Question 2: What percentage of the federal budget do you think is spent each year on the nation's manned and unmanned space programs?
Take-Home Point! Watch out for loaded survey questions!!!
Less than 1% 20% <---- 1% to 5% 37% 5% to 10% 19% More than 10% 17% Not sure 8% Zogby International - Research Poll(7/3/03) Question 2: What percentage of the federal budget do you think is spent each year on the nation's manned and unmanned space programs?
5 questions; Margin of error: +/- 3%, Conducted before Presidential vision announced Rumors of a “trillion dollar space boondoggle” “Bush” Moon/Mars plan opposed (43% - 52%) “United States” Moon/Mars plan split (48% - 48%) (9% swing) Ipsos - Public Affairs Poll for AP(1/12/2004)
Q1: ... expanding the space program ... Considering all the potential costs and benefits ... Q2: Some have suggested that space exploration on the moon and Mars would be more affordable using robots than sending humans... Q4: ... our investment in space research ... better spent on domestic programs such as health care and education? Ipsos - Public Affairs Poll for AP(1/12/2004)
Poor terminology: cost vs investment Lack of accurate information (rumors) Lack of CONTEXT "The space program is too expensive!!"Where does this perception come from?
Public Perception • Baseline Mission • NASA Budget • US Government Budget • US Economic Activity • Public Perception
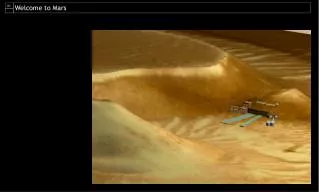
Mission Baseline: Mars Direct • Goal: Good science • Crew of 4 for 2 years • 500 km surface range • Payload: 54 tonnes • Risk: Medium • 7 years to develop • $3.5 billion / year
Take-Home Points! INVESTMENT PER YEAR is a good metric to use. Media estimates like "One Trillion Dollars" are meaningless rubbish.
Mission Baseline: Mars Direct(from NASA/ESA study, Hunt & van Pelt, 2003)
Mission Baseline: Mars Direct(from NASA/ESA study, Hunt & van Pelt, 2003)
Take-Home Points! ONGOING investment/year is more interesting than DEVELOPMENT investment/year A reasonable ongoing estimate for a Mars science mission is $3.5 billion/year
Public Perception • Baseline Mission • NASA Budget • US Government Budget • US Economic Activity • Public Perception
What is NASA's proposed 2005 budget? $145 Billion $ 42 Billion $ 33 Billion $ 16 Billion $ 9 Billion NASA Budget Question:
What is NASA's proposed 2005 budget? $145 Billion $ 42 Billion $ 33 Billion $ 16 Billion <------ $ 9 Billion NASA Budget Answer:
What percentage of the 2005 NASA budget is invested in “Human Space Flight"? 92 % 72 % 52 % 32 % 12 % NASA Budget Question:
What percentage of the 2004 NASA budget is invested in “Human Space Flight"? 92 % 72 % ------> 52 % 32 % 12 % NASA Budget Answer:
TOTAL OUTLAYS: $16.2 100% Space Science: $ 4.1 25% Earth Science: $ 1.5 9% Biological/Physical Research: $ 1.0 6% Aeronautics: $ 0.9 6% Education: $ 0.2 1% Space Flight (ISS, Shuttle, Ops): $ 6.7 41% ISS, Ops: $ 2.4 Shuttle: $ 4.3 Exploration Systems: $ 1.9 11% NASA Budget: 2005(proposed, billions) (from www.nasa.gov/about/budget/index.html)
Take-Home Point! The proposed 2005 budget for the Space Shuttle and Exploration Systems is $6.2 billion per year. But what does this number really mean? We still need a proper CONTEXT.
Public Perception • Baseline Mission • NASA Budget • US Government Budget • US Economic Activity • Public Perception
What is the proposed US Federal Budget for 2005? $ 2400 Billion $ 1700 Billion $ 1000 Billion $ 800 Billion $ 300 Billion US Government Budget Question:
What is the proposed US Federal Budget for 2005? $ 2400 Billion <---- $ 1700 Billion $ 1000 Billion $ 800 Billion $ 300 Billion US Government Budget Answer:
Take-Home Point! The entire 2005 NASA budget is ~$16 billion, LESS THAN ONE PERCENT of the federal budget. Note: This is still true even when the $5.7 billion NSF budget is added.
TOTAL OUTLAYS: $2400 (100%) Social Security: $ 510 (21%) Medicare/Medicaid: $ 478 (20%) $ 445 (19%) Defense: $ 429 (18%) Health & Human Services: $ 68 ( 2.8%) Education: $ 57 ( 2.4%) Homeland Security: $ 47 ( 2.0%) HUD: $ 31 ( 1.3%) NASA budget: $ 16 ( 0.7%) 2005 US Government Budget(proposed, billions) (from http://www.whitehouse.gov/omb/budget/fy2005/tables.html)
TOTAL OUTLAYS: $2400 (100%) Social Security: $ 510 (21%) Medicare/Medicaid: $ 478 (20%) BUDGET DEFICIT: $ 445 (19%) Defense: $ 429 (18%) Health & Human Services: $ 68 ( 2.8%) Education: $ 57 ( 2.4%) Homeland Security: $ 47 ( 2.0%) HUD: $ 31 ( 1.3%) NASA budget: $ 16 ( 0.7%) 2005 US Government Budget(proposed, billions) (from http://www.whitehouse.gov/omb/budget/fy2005/tables.html)
TOTAL OUTLAYS: $2400 (100%) Budget deficit: $ 445 ( 19%) NASA budget: - $ 16 ( 0.7%) ------- 2005 budget deficit w/o NASA: $ 429 ( 18%) 2005 US Government Budget Without NASA(proposed, billions) (from http://www.whitehouse.gov/omb/budget/fy2005/tables.html)
Take-Home Points! The US Government operates on DEFICIT / SURPLUS spending. Any money "saved" reduces the deficit. Any money spent elsewhere increases the deficit.
Take-Home Points! If the US Government wants to spend more money on welfare, health care, or education, IT WILL. Investment in spaceflight is irrelevant to such decisions.
Take-Home Points! Deficits are paid off over time, possibly by our children and our grandchildren. These are the same generations that will benefit the most from deficit INVESTMENTS into the space program.
Budget deficit (2005): $ 445 Extra tax revenue – economy imprv. (2005): $ 82 Military weapons R&D (2005): $ 66 Proposed 6-year highway bill (2004): $ 53 ($318) Iraq war (2003, est 3/24): $ 75 Med/Med fraud (yearly, est): $ 26 Airline bailout (2002): $ 20 Farm subsidies (2004): $ 19 NASA budget: $ 16 Med/Med cost overrun (2004, est): $ 4 + Mars Direct (not): $ 4 Misc US Government Investments(billions) (from misc media/gov sources)
Total US Population (8/12/2004): 293,985,161 Colorado population (7/2005 projected): 4,400,000 (1.5%) 2005 Colorado General Fund: Total 2005 Outlay Request: $ 5.6 --> $ 374 Dept of Education: $ 3.2 --> $ 214 Dept of Health Care: $ 1.2 --> $ 83 Dept of Human Services: $ 0.5 --> $ 31 NASA budget: $ 0.2 <-- $ 16 (County? Local? ...) (US) State Government Statistics(billions) (from http://www.census.gov and http://www.state.co.us)
Public Perception • Baseline Mission • NASA Budget • US Government Budget • US Economic Activity • Public Perception
US GDP: 8/2003 - 7/2004 (www.bea.gov): $ 11649 (100%) 2005 proposed US Government Budget: $ 2400 (20.6%) 2005 proposed NASA Budget: $ 16 (0.14%) United States Economy(billions)
US Trade deficit, June, 2004 (Commerce Dept): $ 56 Microsoft 2004 revenue: $ 37 Microsoft mid-2004 cash reserve: $ 50 Microsoft 2004 special dividend: $ 32 General Motors 2003 revenues: $ 186 General Motors end-2003 assets: $ 288 Walmart Q2/2004 revenues: $ 70 Misc US Economy Figures(billions)
2002 State Farm "Administrative Fees" (State Farm): $ 7.0 Yearly 1990's golf course construction (USPGA): $ 9.5 Average assets of 10 random investment management firms (Pacific Life, 2003): $ 390.7 Yearly Europe/US ice cream purchases (UN,USDA): $ 31.0 2002 US alcoholic beverages (www.usda.com): $ 114.0 Yearly artwork sold worldwide (art-exchange.com): $ 100.0 US yearly cost of spam e-mail (Nucleus Research, 7 min/day): $ 87.0 Hurricane Charley insurance payouts (est): (AP): $ 11.0 More US Economy Figures(billions)
Take-Home Points! Mars Direct can be funded... • By 1 out of every 8 ice cream purchases.... • By 1 out of every 25 beer and wine purchases... • By reducing the cost of spam e-mail by 5%...
Public Perception • Baseline Mission • NASA Budget • US Government Budget • US Economic Activity • Public Perception
Sponsored by the Coalition for Space Exploration No loaded up-front questions, less bias Realistic CONTEXT provided NASA budget request less than 1% this year $55 per year for the average taxpayer No political baggage Gallup Research Poll(7/2004)(Jim Banke, Coalition for Space Exploration & The Space Foundation)
Ipsos-AP: “Bush” plan opposed (43% - 52%) “US” plan split (48% - 48%) Gallup: Plan strongly favored (68% - 24%) Moon/Mars Initiative Support
Take-Home Point! To remove more than half (24% – 28%) the opposition to the Moon/Mars plan: • Remove politics • Cap the investment at 1% of the federal budget.
This presentation may be freely distributed. Please contact the author with any suggestions or corrections. • http://www.boulder.swri.edu/~benke/present/mars/economics2004.html Brian Enke Southwest Research Institute benke@boulder.swri.edu Author: Shadows of Medusa www.shadowsofmedusa.com