Slide Note
0 likes | 12 Views
The ongoing discussions surrounding medicinal product expenditure in Greece highlight the unresolved issues in off-hospital spending. Various measures, from macroeconomic level interventions to microeconomic protocols, aim to rationalize expenditure but face limitations. The shift in expenditure patterns and the impact of different approaches on the market dynamics underscore the complexity of managing pharmaceutical costs. Understanding the structure of the market and the need for strategic planning are crucial in addressing the high expenditure on medicinal products in Greece. Utilizing OECD data for benchmarking and policy-making can provide valuable insights into improving the consumption of medicinal products within the country.

E N D
Truths and lies for the consumption of medicinal products in Greece 1 1
Why are we still discussing about medicinal products in Greece? Off-hospital expenditure (reimbursed purchase) in Greece: 2012-2019 We are still discussing about it because the problem unsolved remains Source: ΙΟΒΕ 2020 2
What implemented pharmaceutical expenditure problem? kind of in measures order can be the to manage • Generally speaking, measures for the rationalization of pharmaceutical expenditure can be distinguished, from one extent, to measures: – “From the top to the bottom”, i.e. measures aiming at defining the expenditure at a macroeconomic (overall) level. Characteristic examples: fixing of the budget level, clawbacks, injections to the budget etc. – “From the bottom to the top”, i.e. measures aiming at affecting daily interactions, which in the aggregate shape the expenditure (measures at microeconomic level). Characteristic examples: prescription protocols. 3
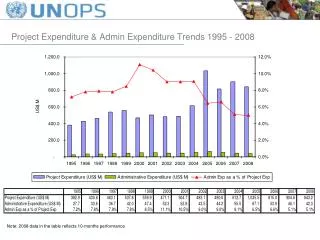
“From the top to the bottom” measures or the rationalization advantages and restrictions of the market: • “From the top to the bottom” measures and their effect on the expenditure: – They are usually “fire- suppression” measures, with a direct impact – Their nature however, renders them measures of temporary efficiency. A characteristic example: clawback Source: ΙΟΒΕ 2020 4
Second characteristic case: Closed budget and shift of expenditure Off-hospital sales of medicinal products in Greece: 2009-2018 2009 2018 6.770.606.968 4.114.314.394 Total sales: values in (Euro) 465.752.093 470.874.752 Total sales: packages 649.656.941 362.614.492 Parallel exports: values 19.062.426 22.043.007 Parallel Exports (PE): packages 443.709.086 451.812.326 Actual sales (excluding PE): packages 6.120.950.027 3.751.699.902 Actual sales (excluding PE): values 3.684.413.281 3.751.699.902 Actual sales in constant 2018 prices 5.108.000.000 1.945.000.000 Public pharmaceutical expenditure (nominal prices) 3.074.683.335 1.945.000.000 Public pharmaceutical expenditure (2018 prices) 1.012.950.027 1.806.699.902 Private pharmaceutical expenditure (nominal prices) 609.729.946 1.806.699.902 Private pharmaceutical expenditure (2018 prices) 1.196.969.956 Increase in the private pharmaceutical expenditure (2018-2009) 82.000.000 1.029.000.000 Rebates/Clawbacks 5
Second characteristic case: closed budget and shift of the expenditure ΟΟΣΑ 2012-2018 and other calculation 6
“From the bottom to the top measures for the rationalization of the market: the solution to the problem? • “From the bottom to the top” measures and their effect on the expenditure: – They affect exchanges at a personal level (what medicinal product is administered and to which patient) – All exchanges affect the total consumption level and thus the expenditure – Measures of this type have a permanent result, which however will be seen in the non-imminent future – Measures of this type require a strategic planning, data, tokens and a careful application (as well as feedback, via the use of the data produced) 7
Structure of the medicinal products market and the need for “from the bottom to the top” measures How is the medicinal products expenditure generated? An analysis of synthetic components Expenditure = p*(q*n)*r Consequently the final expenditure is determined by: - the prices - the consumption volume - The composition of the medicinal products “basket” (new/old ones) Kyriopoulos 2010, Gerdtham 1998 8
Consumption of medicinal products in Greece • The consumption and the expenditure of medicinal products in Greece is an ongoing – and in part, inconclusive – topic. • Public dialogue on consumption of medicinal products in Greece is characterized by rather arbitrary assessments – Result of the absence of a reliable source and, – Consequently, it is characterized by arbitrary conclusions in terms of consumption. As a result thereof, it could constitute the non-rational basis on which the next measures for the medicinal products policy in the country will be founded. 9
Finally, is the consumption of medicinal products in Greece high or low? • The basis of the Organization for Economic Co- operation and Development (OECD) – Central informational depository for medicinal products consumption, which is generated with a specific available methodology – Ability of inter-State and historical comparisons – Main source of information for policy-making for medicinal products at an international level and in Greece: – Any attempts/measures applied in Greece in the recent past, have taken into account the OECD data as a criterion for the position of Greece in Europe 10
The database of the Organization for Economic Co-operation and Development (OECD) Consumption of medicinal products based on the ATC/DDD system Consumption data for the following categories • • ATC Codes (2019 Index) Description A A02B ATC Codes (2019 Index) G03 Description Sex hormones and modifiers acting in the genital system GI tract and metabolism Medicinal products for the treatment of GI ulcer and gastro-esophageal reflux H Hormone preparations, excluding the genital hormones A10 J Medicinal products administered for diabetes Medicinal products against infections for systematic administration Antibiotics for systematic administration Medicinal products for arthropathies and myosceletal diseases Non-steroidal anti-inflammatory drugs and antirheumatic drugs Nervous system Analgesics Tranquilizers Hypnotics and sedatives Antidepressants Respiratory system Medicinal products for air tract blocking diseases B Blood and hematopoietic organs C C01A C01B Cardiovascular system Cardiac Glycosides Antiarrhythmic medicinal products. Categories I and ΙΙΙ J01 M C02 Antihypertensive medicinal products M01A C03 C07 C08 Diuretic medicinal products B-adrenergic receptors blockers Calcium canal blockers N N02 N05B N05C N06A R R03 C09 Antihypertensive factors acting in the renin- angiotensin system Hypolipidemic agents C10 G Urogenital system and sex hormones Πηγή: OECD Health Statistics 2019 Definitions, Sources and Methods: Pharmaceutical consumption by DDDs 11
The database of the Organization for Economic Co-operation and Development (OECD) Data availability: – From 2000 and forth. Almost for all countries, information on all listed categories is available for the past five years – 27 countries – The major European countries participate – Ability to create inter-State comparisons – Important element: information in relation to the legal basis of the products included in the database is available • Drugs dispensed in hospitals • Inclusion/Non inclusion of non-reimbursed drugs • Inclusion/Non inclusion of OTC drugs • Ability to compare Greece with clearly respective countries or analysis under certain assumptions • 12
Examining the medicinal products consumption in Greece and the EU Exploitation of the available data of OECD in relation to the pharmaceutical consumption Reference year: 2017 and 2018, with respect to the data availability. – Direct readjustment of the exercise with updating of the database Measuring Unit Index: Defined Daily Dose (DDD)* per 1000 habitants per day Classification of medicinal products: per main ATC Cluster and then at a second or third level of each main ATC cluster, if data exists Methodological differences in recording consumption of medicinal products in the OECD database: – In some countries, in contrast to Greece, the OTC, non-reimbursed or medicinal products distributed to hospitals are included in the calculation of the consumption of medicinal products. • • • • • * Defined daily dose is the average daily preservation dose in grams of a medicinal products which is administered, based on the official indications thereof, to an adult patient 13
Examining the medicinal products consumption in Greece and the EU European countries of the OECD included in the analysis Medicinal products distributed in hospitals ✕ ✕ ✓ ✓ ✓ ✓ ✓ ✕ ✕ ✓(up to 2006) Ν/Α ✓ Non- reimbursed medicinal products ✕ ✕ ✓ ✓ ✓ ✓ ✓ ✕ ✕ ✓(up to 2006) Ν/Α ✓ Medicinal products in hospitals Non-reimbursed OTC Country OTC Country ✕ ✕ ✓ ✓ ✓ ✓ ✓ ✕ ✕ ✓(up to 2006) Ν/Α ✓ ✕ Ν/Α ✓ ✕ ✕ Ν/Α ✓ ✕ Austria Belgium Czech R. Denmark Estonia Finland France Germany Greece Hungary Italy Latvia Lithuania Luxemburg Ν/Α Ν/Α ✓ ✕ The Netherlands ✕ Norway Portugal Slovakia Slovenia Spain Sweden United Kingdom ✕ ✓ ✓ ✓ ✓ ✕ ✓ ✕ ✕ ✓ ✓ ✓ ✓ ✕ ✓ Ν/Α ✓ ✕ ✓ ✕ ✕ ✓ ✕ Ireland Iceland ✕: no, ✓: yes, N/A: not available data OECD Health Statistics 2019 Definitions, Sources and Methods: Pharmaceutical consumption by DDDs 14
Α1) Consumption of medicinal products per main ATC clusters in Greece and the OECD European Countries 600 Greece presents the higher consumption In the main clusters ATC B & J, while it presents the lower in all other clusters DDD per 1000 habitants per day 482.1 500 443.5 400 300 240.6 223.1 193.1 185.5 200 143 . 14 5 2.4 107.9 74.9 66.9 62.4 100 39.9 38.8 34.4 23.519,3 20.4 0 A B C G H J M N R Main ATC cluster Greece Average of OECD European countries Reference year: 2017 European countries of the OECD: Greece, Austria, Belgium, Czech Republic, Denmark, Estonia, Finland, France, Germany, Hungary, Iceland, Italy, Latvia, Lithuania, Luxemburg, The Netherlands, Norway, Portugal, Slovakia, Slovenia, Spain, Sweden and United Kingdom Source: OECD Stat and own calculations 15
Results: Α1) Consumption of medicinal products per ATC cluster in Greece and the OECD European countries Greece shows the higher consumption in the main ATC B & J clusters and the lower in all other clusters. The highest differences are noticed in the main ATC clusters B- blood and hematopoietic organs (+56.7%), H-hormone preparations, except of genital hormones (-48.9%), G-urogenital system and sex hormones (-44.8%), M- arthropathy and myoskeletal diseases drugs (-42.0%) and R- respiratory system. (-30.5%) • • Main ATC Cluster A B C G H J M N R Greece Average of OECD European Countries 185.5 223.1 443.5 34.4 20.4 23.5 38.8 143.5 74.9 240.6 142.4 482.1 62.4 39.9 19.3 66.9 193.1 107.9 Έτος αναφοράς: 2017 Ευρωπαϊκές χώρες του ΟΟΣΑ: Ελλάδα, Αυστρία, Βέλγιο, Τσεχία, Δανία, Εσθονία, Φιλανδία, Γαλλία, Γερµανία, Ουγγαρία, Ισλανδία, Ιταλία, Λετονία, Λιθουανία, Λουξεµβούργο, Ολλανδία, Νορβηγία, Πορτογαλία, Σλοβακία, Σλοβενία, Ισπανία, Σουηδία και ΗνωµένοΒασίλειο difference Percentile -22,9% +56,7% -8,0% -44,8% -48,9% +21,9%-42,0%-25,7%-30,6% Source: OECD Stat and own calculations 16
Α2) Consumption of medicinal products per second and third ATC level in Greece and in the OECD European Countries Greece presents the highest 250.0 Consumption in 7/18 ATC at the second and third level. It presents the lowest consumption in 11/18 DDD per 1000 habitants per day 191.6 200.0 173.7 150.0 116.0108.3 100.0 77.180.7 72.1 68.6 63.0 50.4 55.6 48.3 55.1 50.9 45.6 45.4 45.2 42.5 50.0 28.3 34.6 32.1 21.3 32.1 25.3 20.3 7.0 18.0 9.7 9.2 1.9 2.3 6.5 4.8 5.7 3.7 1.2 0.0 C03 C07 G03 C08 C09 C10 A02B A10 N02 N05B N05C N06A R03 C01BC02 J01 M01A C01A ATC Cluster Greece Average of OECD European Countries Reference year: 2017 European countries of the OECD: Greece, Austria, Belgium, Czech Republic, Denmark, Estonia, Finland, France, Germany, Hungary, Iceland, Italy, Latvia, Lithuania, Luxemburg, The Netherlands, Norway, Portugal, Slovakia, Slovenia, Spain, Sweden and United Kingdom Source: OECD Stat and own calculations 17
Α2) Consumption of medicinal products per second and third ATC level in Greece and in the OECD European Countries Greece presents the highest consumption in Clusters A10, C01Β, C07, C10, J01, NO5B and R03 and the lowest in all other clusters. • The highest differences are noticed in Analgesics (-95,3%), G03- Sex hormones and modifiers effecting the genital system (-89,3%), Μ01Α- Non-steroidal anti-inflammatory drugs and antirheumatic drugs (-79,9%), J01-Antibiotics for systematic adminstration (+78,4%), Hypnotics and sedatives (-68,1%) και C01B-Antiarrythmic, Clusters Ι and ΙΙΙ (+46,4%) • ATC Cluster A02B A10 C01A C01B C02 C03 C07 C08 C09 C10 G03 J01 M01A N02 N05B N05C N06A R03 Greece 72.1 80.7 1.9 7.0 5.7 28.3 50.9 45.2 173.7 116.0 3.7 32.1 9.2 1.2 25.3 6.5 55.1 48.3 Average of OECD European Countries 77.1 68.6 2.3 4.8 9.7 42.5 50.4 55.6 191.6 108.3 34.6 18.0 45.4 32.1 21.3 20.3 63.0 45.6 Έτος αναφοράς: 2017 Ευρωπαϊκές χώρες του ΟΟΣΑ: Ελλάδα, Αυστρία, Βέλγιο, Τσεχία, Δανία, Εσθονία, Φιλανδία, Γαλλία, Γερµανία, Ουγγαρία, Ισλανδία, Ιταλία, Λετονία, Λιθουανία, Λουξεµβούργο, Ολλανδία, Νορβηγία, Πορτογαλία, Σλοβακία, Σλοβενία, Ισπανία, Σουηδία και ΗνωµένοΒασίλειο Percentile difference -6,5% +17,6% -17,1% +46,4% -40,9% -33,4% +1,1% -18,7% -9,3% +7,1% -89,3%+78,4%-79,7% -96,3%+18,7% -68,1% -12,5% +5,9% Source: OECD Stat and own calculations 18
Β1) Consumption of medicinal products per main ATC cluster in Greece and European countries which apply the same reporting methodology with Greece 600 Greece presents the highest consumption in the main ATC Clusters B & J and the lowest in all others. DDD per 1000 habitants per day 483.4 500 443.5 400 300 257.9 223.1 160.9 200 185.5 143.5 127.4 74.9 78.5 100 57.4 34.4 42.5 41.5 38.8 23.5 20.4 18.0 0 A B C G H J M N R Main ATC Cluster Greece with Greece Average of European Countries with similar reporting methodology Reference year : 2017 OECD European countries with similar reporting methodology with Greece : Belgium, Germany, Hungary, Luxemburg, the Netherlands and Spain Source: OECD Stat and own calculations 19
Β1) Consumption of medicinal products per main ATC cluster in Greece and European countries which apply the same reporting methodology with Greece Compared to the previous analysis (A), the differences are less noticeable, with the exception of ATC Clusters Α,B & J. As in the previous analysis, Greece presents the highest consumption in Clusters B & J and the lowest in all other Clusters. The highest differences are noticed in the main ATC clusters B- blood and hematopoietic organs (+75.1%), H-hormone preparations, except of genital hormones (-50.9%), M- arthropathy and myoskeletal diseases drugs (-32.4%) • • • Main ATC Cluster A B C G H J M N R Greece Average of OECD European countries with similar reporting methodology with Greece 185.5 223.1 443.5 34.4 20.4 23.5 38.8 143.5 74.9 257.9 127.4 483.4 42.5 41.5 18.0 57.4 160.9 78.5 Percentile difference -28,1% +75,1% -8,3% -19,0% -50,9% +30,3% -32,4% -10,8% -4,5% Reference year: 2017 OECD European countries with similar reporting methodology with Greece : Belgium, Germany, Hungary, Luxemburg, the Netherlands and Spain Source: OECD Stat and own calculations 20
Β2) Consumption of medicinal products per second and third ATC cluster in Greece and European countries which apply the same reporting methodology with Greece Greece presents the highest consumption in ATC 6/18 at the second level and the lowest consumption in 12/18 at the third level 250.0 DDD per 1000 habitants per day 199. 6 200.0 173. 7 150.0 116.0 111.8 87.280.7 72.1 100.0 71.8 52.7 55.1 57.3 46.9 44.5 50.9 45.2 48.3 40.0 50.0 25. 3 32.1 31.0 28.3 22.8 21.8 7.0 20.3 10.3 5.7 17. 3 14.2 1.9 9.2 6.5 5.0 3.7 2.0 1.2 0.0 A02B A10 C01A C01B C02 C03 C07 C08 C09 Ομάδα ATC C10 G03 J01 M01A N02 N05B N05C N06A R03 Greece Average of European Countries with similar reporting methodology with Greece Reference year: 2017 OECD European countries with similar reporting methodology with Greece : Belgium, Germany, Hungary, Luxemburg, the Netherlands and Spain Source: OECD Stat and own calculations 21
Β2) Consumption of medicinal products per second and third ATC cluster in Greece and European countries which apply the same reporting methodology with Greece Greece presents the highest consumption in Clusters A10, C01Β, C10, J01, NO5B and R03 and the lowest in all others. • The highest differences are noticed in Clusters N02-Analgesics (-94.5%), J01- Antibiotics for systematic administration (+86.1%), G03- Sex Hormones And modifiers effecting the genital system (-81.8%), M01A- Non – steroidal anti-- inflammatory drugs and antirheumatic drugs (-70.3%), N05C-Hypnotics and sedatives (-54.2%), C02-Antihypertensive (-44.7%) and C01B-Antiarrythmic, Clusters Ι and ΙΙΙ (+41.1%) • ATC Cluster Greece Average of OECD European countries with similar reporting methodology with Greece Percentile difference A02B 72.1 A10 C01A C01B 80.7 1.9 C02 5.7 C03 28,. 50.9 45.2 173.7 116.0 C07 C08 C09 C10 G03 3.7 J01 M01A 32.1 N02 1.2 N05B N05C N06A 25.3 R03 48.3 7.0 9.2 6.5 55.1 87.2 71.8 2.0 5.0 10.3 40.0 52.7 46.9 199.6 111.8 20.3 17.3 31.0 21.8 22.8 14.2 57.3 44.5 -17,3%+12,4% -6,2%+41,1% -44,7%-29,2%-3,3%-3,5%-13,0%+3,8%-81,8%+86,1% -70,3%-94,5%+10,8%-54,2% -3,8% +8,6% Reference year: 2017 OECD European countries with similar reporting methodology with Greece : Belgium, Germany, Hungary, Luxemburg, the Netherlands and Spain Source: OECD Stat and own calculations 22
Certain Conclusions • Apart from consumption of medicinal products in Greece is near (or below) the average of the OECD countries some exceptions, results show that the • This fact shows that the medicines policy needs to turn to measures for the other two components of the expenditure, in order to be successful • The management of major problems in the market will require measures of a fiscal (from the top to the bottom) and a reforming (from the bottom to the top) nature. For example, a proposal for the resolution of the clawback issue could include the following: 23
Resolving the clawback issue: a proposal to be discussed • A series of points for managing the clawback issue in the short- and in the long-run • A proposal founded on the structural characteristics of the medicinal products market in Greece and on the fiscal requirements • Presentation and consultation on the initial points in a meeting between experts • Final points after including the views of the parties involved 24
Section Α. Immediate effect measures 1. Prompt re-pricing of all medicinal products. External reference prices without increases. – Accompanied by economic incentives for the selection of alternative generics at a personal level (patients, pharmacists) 2. Voluntary price decrease – The overall price decrease shifts to the participation of the user 3. Removal from the “type ΗΤΑ“ process of biosimilars and generics (concerns both “committees”) – Pricing by a maximum rate of the price of the reference product 25
Section Α. Immediate effect measures 4. “Direct” negotiations for the 10 major therapeutic clusters – Horizontal negotiations with all MAHs per cluster – Non-disclosed horizontal rebate – subtraction from the CB – No agreement = No reimbursement – Cutting down of expenditure around Euro 350 m. – Effective period of the measure: max of 2 years, since it establishes strong distortions 5. Formation of the “Chief EOPYY Physician” institution – Insurance directions production team – Focus on selection of treatments with the maximum efficiency (generics-biosimilars at the front line etc.) 26
Section Β. Structural/Long-term measures 1. Prescription measures focusing of the consumption mix. Connection of the prescription system (protocol) with the informational systems of the laboratories 2. “Normalization” of the packages of marketed generics 3. Escalated joint responsibility over a certain limit of the clawback, in order to deal with the “ethical danger” in the creation of a health policy 4. Proportional subtraction of amounts for investments in research, capital and labour from the calculation of the clawback when clawback exceeds a specific limit 27
Section Β. Structural/Long-term measures 5. Settlement of prior debts in monthly instalments which may be offset against the MAHs receivables 6. Formation of an analysis team for e-prescription and a team that will follow-up the course of negotiations, in EOPYY 7. Total restructuring of the HTA process, based on the internationally applied accepted standard 8. Revision of the “positive list” 9. Clarification of accounting sizes (clawback calculation in retail prices, VAT issues etc.) 28
Section Β. Structural/Long-term measures 10. Introduction of negotiations systems. Separation of negotiations from the HTA (except of the entry negotiations). Negotiations at a ATC5 or ATC4 level to the competency of monopsony 11. Reinforcement of procedures within the context of the controlled entry agreements, focusing on the “price-volume" and “risk-sharing“ agreements 29