Analyzing Turnover: Uncovering Key Insights Through Performance Categorization
This analysis delves into turnover root causes by integrating new data elements, such as Performance Category, to enhance existing data insights. While the data indicates success in eliminating low performers, it also highlights procurement challenges affecting high performers. A detailed exploration shows that turnover is significantly influenced by compensation issues, particularly among Programmers and QA roles. Further investigations aim to identify strategies to mitigate these job losses, including adjustments to bill rates and turnover thresholds for a more sustainable workforce.

Analyzing Turnover: Uncovering Key Insights Through Performance Categorization
E N D
Presentation Transcript
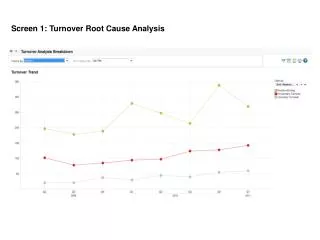
Screen 2: Drill Down Introducing new data elements (e.g., Performance Category) helps to discover new insights in the existing data. This is the same data as Screen1, but trellised by Performance Category. The data shows that the program does well in removing low performers, but the procurement data must be explored. An examination of high performers shows that a problem exists which is leading to the loss of quality resources. To further understand what is driving the trend, the last defined period is selected and further drilled down.
Screen 3: Further Drill Down Sorting the data by reason for leaving shows that a compensation problem exists, and further analysis reveals more specifically that the majority of the roles citing this issue are Programmers and QA. This analysis lends itself to discussion about mitigating these job losses, such as increasing bill rates for these roles or setting thresholds for reduction in turnover to break even from cost to hire.