Download
1 / 10
100 likes | 255 Views
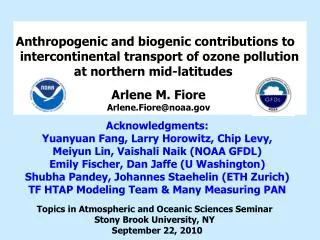
CAM- Chem and hemispheric transport of ozone and PAN. Arlene M. Fiore. Acknowledgments: Larry Horowitz, Vaishali Naik (NOAA GFDL) Emily Fischer, Dan Jaffe (U WA) Johannes Stähelin , Shubha Pandey (ETH Z ϋ rich) TF HTAP Modeling Team GFDL Atmospheric Model Development Team.

E N D
CAM-Chem and hemispheric transport of ozone and PAN Arlene M. Fiore Acknowledgments: Larry Horowitz, VaishaliNaik(NOAA GFDL) Emily Fischer, Dan Jaffe (U WA) Johannes Stähelin, ShubhaPandey (ETH Zϋrich) TF HTAP Modeling Team GFDL Atmospheric Model Development Team Chemistry-Climate Working Group 15th Annual CCSM Workshop, Breckenridge, CO June 29, 2010
Multi-model effort to quantify & assess uncertainties in N. mid-latitude hemispheric O3 transport EMEP CASTNet EANET Task Force on Hemispheric Transport of Air Pollution (TF HTAP) to inform policy negotiations under CLRTAP BASE SIMULATION (21 models): horizontal resolution of 5°x5° or finer 2001 meteorology each group’s best estimate for 2001 emissions methane set to 1760 ppb SENSITIVITY SIMULATIONS (13-18 models): -20% regional anthrop. NOx, CO, NMVOC emissions, individually + all together (=16 simulations)
Models differ in estimates of surface O3 response to foreign emission changes… which are most accurate? O3 decrease from -20% foreign anthropogenic NOx+CO+NMVOC emissions Over EU Over NA Fiore et al., JGR, 2009 • No obvious correlation of strength of foreign influence with individual model biases relative to O3 observations [Fiore et al., JGR, 2009; Reidmiller et al., ACP 2009;Jonson et al, ACPD 2010 ] • Generally not due to model differences in anthropogenic emissions (one exception)
Sensitivity of exported EU O3 to large spread in EU NMVOC inventories (anthrop. NOx fairly similar across models) Annual mean surface O3 decrease over NA (ppb) from 20% decreases in anthrop. EU NMVOC CAM-Chem Individual models MOZART2 (GFDL) EU Anthrop. NMVOC Emissions (Tg C) Fiore et al., JGR, 2009
PAN: A more sensitive indicator of emission changes?[Jaffe et al., Fall AGU, 2007] 5 mountain sites with multi-year observed PAN (and some NOy) No obs in 2001 (year used by models) Standard deviation CAM-Chem Individual models MOZART-2 (GFDL)
Model differences in relative contributions of source regions to PAN at Mount Bachelor, Oregon, USA 4 example HTAP models sampled at Mount Bachelor 0.8 0.6 0.4 0.2 0.0 Model fraction of PAN from source region EUNAEASA MOZART CAM-Chem EA/EU PAN influence correlates with EA/EU AVOC emissions More EA influence Mount Bachelor, April: r2=0.85 Individual HTAP models Model EA_PAN/EU_PAN MOZART2 (GFDL) CAM-Chem More EU influence Model EA_AVOC/EU AVOC
Model differences in relative contributions of source regions to PAN at Jungfraujoch, Switzerland 4 example HTAP models sampled at Jungfraujoch 0.8 0.6 0.4 0.2 0.0 CAM-Chem MOZART Model fraction of PAN from source region EUNAEASA More EU influence Jungfraujoch, APRIL: r2=0.40 CAM-Chem Wide range of EU NMVOC inventory contributes to model discrepancies. Constraints from observations? MOZART2 More NA influence
HTAP multi-model sets of experiments: Analysis ongoing • Source-Receptor (SR), -20% anthrop. emissions within HTAP regions (EA, EU, NA, SA, + global), year 2001 -- NOx, CO, NMVOC, CH4, aerosols, Hg, POPs -- AEROCOM: zero out anthrop., dust, biomass burning • Idealized Tracers(TP), 25d lifetime, insoluble and soluble • Event Simulations (ES), June-Sept 2004 to evaluate with ICARTT observations • Future Emissions (FE), 2030 MESSAGE 8.5 and 2050 IMAGE 2.6 • Future Climate (FC), 2100 A2 climate www.htap.org TF HTAP, 2007 HTAP 2010 report in prep Sanderson et al., GRL, 2008; Shindell et al., ACP, 2008; Fiore et al., JGR, 2009, Reidmiller et al. ACP, 2009; Casper Anenberg et al., ES&T, 2009; Jonson et al., ACPD,2010
Status of GFDL CM3 contributions to ACC-MIP (1860) HISTORICAL COMPLETED Others TBD. FUTURE