Download
1 / 30
300 likes | 438 Views
Anthropogenic and biogenic contributions to intercontinental transport of ozone pollution at northern mid-latitudes. Arlene M. Fiore Arlene.Fiore@noaa.gov. Acknowledgments: Yuanyuan Fang, Larry Horowitz, Chip Levy, Meiyun Lin, Vaishali Naik (NOAA GFDL)

E N D
Anthropogenic and biogenic contributions to intercontinental transport of ozone pollution at northern mid-latitudes Arlene M. Fiore Arlene.Fiore@noaa.gov Acknowledgments: Yuanyuan Fang, Larry Horowitz, Chip Levy, Meiyun Lin, VaishaliNaik (NOAA GFDL) Emily Fischer, Dan Jaffe (U Washington) ShubhaPandey, Johannes Staehelin (ETH Zurich) TF HTAP Modeling Team & Many Measuring PAN Topics in Atmospheric and Oceanic Sciences Seminar Stony Brook University, NY September 22, 2010
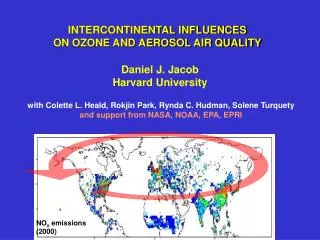
Observing intercontinental transport at northern mid-latitudes: July 2004 Alaskan and Canadian Fires Mean 500 mb carbon monoxide (combustion effluent) retrieved from the AIRS instrument (http://airs.jpl.nasa.gov) Image credit: NASA/JPL; http://photojournal.jpl.nasa.gov/catalog/PIA11034 Frames c/o Yuanyuan Fang, Princeton/GFDL
Intercontinental influence on surface ozone may occur mainly through “hemispheric background” • Intercontinental ozone transport is difficult (impossible?) to observe directly at surface [e.g., Derwent et al., 2003; Fiore et al., 2003; Goldstein et al., 2004; Jonson et al., 2005] • Estimates rely on models (evaluated with observations) • Long-term measurements should contain information on tropospheric (and surface) O3 response to trends in emissions (key tests for models?) 3D Model Structure
Observational and modeling evidence indicates rising baseline tropospheric O3 from human activities Observed free troposphericO3 (3-8km) over the western U.S. in spring [Cooper et al., Nature, 2010] Modeled increase in surface O3 due to tripling Asian anthropogenic emissions from 1985 to 2010 [Jacob et al., GRL, 1999] How much free tropospheric Asian pollution mixes into surface air?
Rising background O3 has implications for attaining ever-tightening air quality standards Figure 2.1 from NRC 2009 report, “Global sources of local pollution”; original content from D.J. Jacob Observational evidence for increasing surface O3 background [e.g. Lin et al., 2000; Jaffe et al., 2003, 2005; Vingarzan, 2004; EMEP/CCC-Report 1/2005 ; Derwent et al., 2007; Jaffe and Ray, 2007; Royal Society, 2008; NRC, 2009 ]
CH3C(O)OONO2 lightning O3 PAN O3, PAN Human activities and “natural” sources influence intercontinental O3 transport NOx+ NMVOC O3 Human activity Fires Biosphere OCEAN OCEAN CONTINENT CONTINENT 2. • PAN as a PATHWAY: contributes to O3 formation far from source region [e.g., Moxim et al., 1996; Heald et al., JGR, 2003; Hudman et al., JGR, 2004;Zhang et al., 2008; Fischer et al., 2010] • PAN as a PROXY: may reflect changing O3 precursor sources better than O3 itself [Jaffe et al., 2007; Fischer et al., 2010] 1. A. Fiore
Wide range in prior estimates of intercontinentalsurface ozone source-receptor (S-R) relationships NORTH AMERICA EUROPE ASIA NORTH AMERICA annual mean events events seasonal mean Surface O3 contribution from foreign region (ppbv) seasonal mean annual mean Studies in TF HTAP [2007] + Holloway et al., 2008; Duncan et al., 2008; Lin et al., 2008 Assessment hindered by different (1) methods, (2) reported metrics, (3) meteorological years, (4) regional definitions Few studies examined all seasons A. Fiore
Multi-model effort to quantify & assess uncertainties in N. mid-latitude hemispheric O3 transport (www.htap.org) EMEP CASTNet EANET Task Force on Hemispheric Transport of Air Pollution (TF HTAP) to inform policy negotiations under CLRTAP BASE SIMULATION (21 models): horizontal resolution of 5°x5° or finer 2001 meteorology each group’s best estimate for 2001 emissions methane set to 1760 ppb SENSITIVITY SIMULATIONS (13-18 models): -20% regional anthrop. NOx, CO, NMVOC emissions, individually + all together (=16 simulations) TF HTAP, 2007, 2010; Sanderson et al., GRL, 2008; Shindell et al., ACP, 2008; Fiore et al., JGR, 2009, Reidmiller et al. ACP, 2009; Casper Anenberg et al., ES&T, 2009; Jonson et al., ACPD,2010 A. Fiore
Multi-model mean captures obs in spring, when hemispheric transport at N. mid-latitudes peaks Monthly mean surface O3 EASTERN USA CENTRAL EUROPE INDIVIDUAL MODELS OBS (EMEP) MODEL ENS. MEAN Surface Ozone (ppb) OBS (CASTNet) Seasonal cycle captured over Europe Month of 2001 High bias over EUS in summer and early fall What observational constraints would best test model suitability for intercontinental transport? A. Fiore
Model ensemble annual mean decrease in surface O3from 20% reductions of regional anthrop. O3 precursors ∑ 3 foreign = 0.45 domestic Foreign vs. “domestic” influence over NA: (1.64) Full range of 15 individual models NA “sum 3 foreign” ppbv EU “domestic” Source region: NA EU EA SA EU+EA+SA EA Spatial variability over continental- scale receptor region (NA) (see also Reidmiller et al, 2009; Lin et al., 2010) SA “import sensitivity” ppbv Fiore et al., JGR, 2009
Seasonality of surface ozone response over North America and Europe to -20% foreign anthrop. emissions Source region: SUM3 NA EAEUSA Receptor = NA Receptor = EU 15- MODEL MEAN SURFACE O3 DECREASE (PPBV) • Spring max due to longer O3 lifetime, efficient transport [e.g., Wang et al., 1998; Wild and Akimoto, 2001; Stohl et al., 2002; TF HTAP 2007] • Response typically smallest to SA emissions (robust across models) • Similar response to EU& EA emissions over NA Apr-Nov (varies by model) • NA>EA>SA over EU (robust across models) Fiore et al., JGR, 2009
SA fairly constant ~0.5 1.1 (EA), 0.7 (EU) during month with max response to foreign emissions 0.2-0.3 during month of max response to domestic emissions Monthly mean import sensitivities (surface O3 response to foreign vs. domestic emissions) Fiore et al., JGR, 2009
UNCERTAINTIES IN ESTIMATES: Surface O3 response to foreign anthrop. emissions varies widely across individual models Multi-model mean Individual models • No obvious correlation of strength of foreign influence with individual model biases relative to O3 observations [Fiore et al., JGR, 2009; Reidmiller et al., ACP 2009;Jonson et al, ACPD 2010 ] • Generally not due to model differences in anthropogenic emissions (one exception) A. Fiore
Strong sensitivity of exported EU O3 to large spread in EU NMVOC inventories (anthrop. NOx fairly similar across models) Annual mean surface O3 decrease over NA (ppb) from 20% decreases in anthrop. EU NMVOC Individual models EU Anthrop. NMVOC Emissions (Tg C) Fiore et al., JGR, 2009
PAN O3 NOx CH3C(O)OONO2 N2O5 NOx+VOC PAN, O3 Models likely differ in export of O3 + precursors, downwind chemistry (PAN [Emmerson and Evans, ACP, 2009]), and transport to receptor region O3 NOy other organic nitrates HNO3 Human activity Fires Land biosphere Ocean Ocean Continent Continent NOy partitioning (e.g., PAN vs. HNO3) influences O3 formation potential far from source region How well do the models used to estimate intercontinental O3 transport simulate observed distributions of PAN? A. Fiore
Comparison of models with PAN measurements at mountain sites in Europe and Western USA Zugspitze (2.67 km) Mt. Bachelor (2.76 km) PAN (ppt) Jungfraujoch (3.58 km) Range across models Multi-model mean PAN (ppt) Selected individual models • No measurements for year 2001; observed interannual variability precludes definitive conclusions as to which models are best • Multi-model mean generally within range of observations • Some models consistently high/low; others vary site to site A. Fiore
Individual models rank differently in terms of absolute vs. relative source attribution Determined by differencing simulations with -20% EU anthrop. emissions from the base case, then x5 PAN FROM EU (ppt) Range across models Multi-model mean Relative attribution matters from a policy perspective. Evaluating models with total observed PAN won’t address relative importance. Observational constraints? FRACTION OF PAN FROM EU A. Fiore
Relative influence of regional O3 precursors on PAN at Mount Bachelor (OR), as estimated by the models 4 example HTAP models sampled at Mount Bachelor 0.8 0.6 0.4 0.2 0.0 Fraction of total PAN from source region EUNAEASA MOZART More EU influence NCEP ECMWF GEOS CMC GCM EU/EA PAN influence correlates with EA/EU AVOC emissions; • …Or meteorology? r2=0.85 Individual models More EA influence A. Fiore
PAN as a pathway for intercontinental O3 transport:How important? MARCH 2001 SURFACE O3 DECREASE (from Base simulation) in CMAQ regional model with boundary conditions (BCs) from the global MOZART-2 model: Only PAN BCs reflect -20% EU anthropogenic emissions BCs for all species reflect -20% EU anthropogenic emissions Large spatial gradients within continental-scale “HTAP” regions PAN decomposition contributes ~20% of spatial average total O3 response; up to ~50% in subsiding plumes at mountain sites [Lin et al., ACP, 2010] A. Fiore
PAN as a proxy: Contributions to PAN from anthropogenic versus lightning NOx sources [Fang et al., JGR, in press] PAN over the eastern U.S. during summer 2004 (INTEX-NA field campaign) July MOZART-4 simulations with: 1999 U.S. AnthroNOx; “low” lightning 2004 U.S. AnthroNOx (-23%); “low” lightning 2004 U.S. AnthroNOx; “high” lightning (10x) (anthro and lightning NOx perturbations are equivalent, in each case changed by 0.16 Tg N) Model (MOZART-4) is sampled along flight tracks Cross-model differences in lightning NOx may contribute to differences in PAN in The middle and upper troposphere; Little lightning influence in lower troposphere where PAN is more sensitive to anthropogenic NOx changes A. Fiore
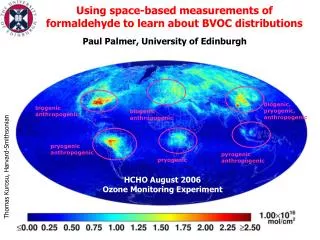
What is the role of BVOC in hemispheric transport of ozone and PAN? Percent of total NMVOC emissions multi-model mean values from HTAP study NON-ANTHROPOGENIC (mainly biogenic NMVOC) ANTHROPOGENIC Rapidly evolving knowledge from lab and field studies [e.g., Lelieveld et al., 2008; Hofzumahaus et al., 2009; Paulot et al., 2009ab; Perring et al., 2009; Brown et al., 2009; and many, many others!] “the treatment of isoprene in global models can only be seen as a first order estimate at present, and points towards specific processes in need of focused future work” [von Kuhlmann et al., 2004] A. Fiore
Explore role of isoprene vs. anthropogenic emission changes in North America with MOZART-2 global model BASE SIMULATION: horizontal resolution of 1.9°x1.9° 2001 meteorology best estimate for 2001 emissions methane set to 1760 ppb SENSITIVITY SIMULATIONS: -20% regional anthrop. NOx, CO, NMVOC emissions, individually + all together (FOCUS ON NA) +20% NA isoprene emissions Interannual variation in NA isoprene emissions ~20-30% [Palmer et al. 2006] A. Fiore
Surface O3 response over Europe (spatial average) to North American emission perturbations Variation across models? -20% NA anthrop. NOx+CO+NMVOC -20% NA anthrop. NOx -20% NA anthrop. NMVOC +20% NA isoprene Surface ozone response over Europe (ppb) O3 response over EU to NA isoprene comparable to NA anth. NOx in summer/fall; larger than NA anth. NMVOC A. Fiore
PAN (700 hPa) response over Europe (spatial average) to North American emission perturbations -20% NA anthrop. NOx+CO+NMVOC -20% NA anthrop. NOx -20% NA anthrop. NMVOC +20% NA isoprene PAN response over EU to NA isoprene comparable to that to all NA anthrop. emissions in summer and fall A. Fiore
PAN response to regional precursor emission changesat a European mountain site (model is sampled at the site) May peak in European anthrop. influence NA isoprene influence on PAN at European mountain site similar to that from NA or EU anth. emissions in summer A. Fiore
Returning to multi-model ensemble… where do models show largest relative discrepancies in PAN? PAN AT 650 hPa RELATIVE STD DEV (s/m) 14-MODEL MEAN (ppt) APRIL JULY Observations at PICO-NARE [e.g., Honrath et al., JGR, 2004] may help in identifying “most useful” models for NA EU intercontinental transport A. Fiore
PAN is relatively more sensitive than ozone to anthropogenic and isoprene emission changes Sensitivity simulations in the global MOZART-2 model: -20% NA anthropogenic emissions -20% NA isoprene emissions Percent change in surface Ozone Percent Change in PAN at 700 hPa PICO-NARE site in the Azores well-positioned for sampling N. American outflow [e.g., Honrath et al., JGR, 2004; val Martin et al., JGR, 2008.] A. Fiore
How will global emissions (and intercontinental O3 transport) change in the future? Implications for U.S. background O3 and attainment of standards? c/o VaishaliNaik, GFDL What about climate change? A. Fiore
Summertime surface O3 changes in a warmer climate in the new GFDL chemistry-climate model (AM3) 20-year simulations with annually-invariant emissions of ozone and aerosol precursors Present Day Simulation (“1990s”): observed SSTs + sea ice (1981-2000 mean) Future Simulation (“A1B 2090s”): observed SSTs + sea ice + average 2081-2100 changes from 19 IPCC AR-4 models Previously noted degradation of summertime EUS O3 air quality e.g., reviews of Jacob and Winner, Atmos. Environ. 2009 and Weaver et al., BAMS, 2009 CHANGES IN SUMMER (JJA) MEAN DAILY MAX 8-HOUR OZONE Previously noted decrease of lower troposphere background O3 e.g., Johnson et al., GRL, 2001; Stevenson et al., JGR, 2006 Climate change expected to reduce intercontinental influence, though net effect determined by climate plus emission changes (human + natural) A. Fiore
Anthropogenic and biogenic influence on intercontinental surface O3:Concluding thoughts and some questions raised • Benchmark multi-model effort: wide cross-model and spatiotemporal variability in intercontinental influence • What is the role of mesoscale (i.e., sub-grid) processes in • mixing air between the free troposphere and the surface? • PAN: Pathway and Proxy for intercontinental O3 pollution • Exploit differences across model ensembles to help guide observational sampling strategies? • Potential for constraints on O3 source attribution via PAN? • NA isoprene influence on EU surface O3 comparable to NA anthrop. NOx in summer and fall • Pay more attention to role of biogenic sources when assessing • impacts of human activities on climate and air quality? A. Fiore