Download
1 / 16
160 likes | 307 Views
The Pattern and Transport of Ozone in the Missouri Region. Prepared for a briefing of the Missouri Director of Natural Resources. Rudolf Husar and Bret Schichtel CAPITA Washington University April 9, 1997.

E N D
The Pattern and Transport of Ozone in the Missouri Region Prepared for a briefing of the Missouri Director of Natural Resources Rudolf Husar and Bret Schichtel CAPITA Washington University April 9, 1997 The content of the report is based largely on the analysis conducted by the OTAG Air Quality Analysis Workgroup, including CAPITA. The comments were adapted to emphasize the conditions relevant to the state of Missouri. Limited additional analysis was conducted to document the Missouri region in more detail.
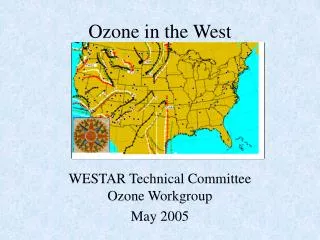
Missouri Ozone Concentrations and Background Ozone Entering the OTAG Domain Average ozone concentrations in Missouri are elevated (50-65 ppb) compared to tropospheric background (30-40 ppb) found at all four corners of the OTAG domain. However, they are lower than the Ohio River Valley and the Eastern Megalopolis concentrations.
Pattern of Ozone Precursor Emissions The high area source emission densities of NOx are located in the vicinity of urban-metropolitan areas such as St. Louis and Kansas City. The high point source emission densities are located mostly in the industrial Midwestern states.
Changing Average O3 Concentrations from West to East West-east cross-section through Kansas-Ohio-Maryland. Note the accumulation of ozone from west to east. Ozone concentration maps with west-east and north-south cross-sections.
Areas of Violations (AOV) for 1hr-120 ppb and 8-hr-80 ppb Exceedances Areas of violation for 1 hr - 120 ppb standard. Areas of violation for 8 hr - 80 ppb standard.
Average Daily Max and Exceedance Rose for Ozone in St. Louis The highest average ozone concentrations are to the north and east of the city. The exceedances tend to occur when the wind direction is from the city.
Average Daily Max and Exceedance Rose for Ozone in Kansas City The highest average ozone concentrations are to the east of the city. The exceedances tend to occur when the wind direction is from the city.
Origin of High Ozone Concentrations The highest ozone concentrations occur in major metropolitan areas, Washington- New York, Atlanta, St. Louis and a large region near Ohio River Valley.
Origin of High Ozone Concentrations, Cont. Back trajectories for receptor sites for low ozone days point to outside the OTAG region as the source of low ozone. Back trajectories for receptor sites for high ozone days point to the central OTAG region as the source of high ozone.
Role of Horizontal and Vertical Transport Transport wind vector during low ozone days indicate transport of clean air from outside the OTAG region. Transport wind vector during high ozone days occurs when the winds are slow and variable, except in the Northeast where they occur during westerly winds.
St. Louis Transport Speed and Directions Low ozone concentrations in St. Louis are associated with ventilating flow from the southwest. High ozone concentrations in St. Louis are associated with slower transport from the east-southeast.
Kansas City Transport Speed and Directions Low ozone concentrations are associated with transport from the southwest as well as from the northwest. High ozone concentrations are associated with slower transport predominantly from the southwest.
Ozone Transport Visualization Measured ozone concentration isopleths overlaid with tracer particles tracking the atmospheric flow.
Ozone in Urban and Power Plant Plumes The St. Louis ozone plume measured on July 18, 1975. The excess ozone within the plume is 20-30 ppb. Ozone production in a power plant plume on August 23, 1978. Ozone production begins after about 100 km.
Spatial Pattern of High and Low Ozone Concentrations Spatial pattern of the 10th percentile of daily max. ozone. Elevated ozone concentrations are evident only in the Industrial Midwest. Spatial pattern of the 90th percentile of daily max. ozone. Highest ozone occurs in metropolitan regions. St. Louis and Kansas City impact their surrounding only on high ozone days.
Evidence that Precursor Emission Changes Cause Ozone Changes Map of exceedances on Fridays. Map of exceedances on Sundays. Any control strategy that mimics the Weekday-Weekend Emission change would be effective in reducing exceedances over 120 ppb.