Download
1 / 30
300 likes | 425 Views
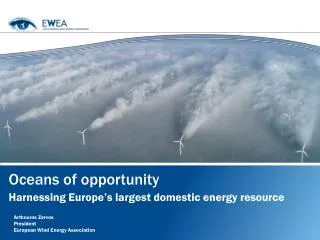
Oceans of opportunity. Harnessing Europe’s largest domestic energy resource. Justin Wilkes Policy Director European Wind Energy Association Renewable Energy and the Sea – Technological Innovation. Outline. The offshore wind power market Building the European offshore grid

E N D
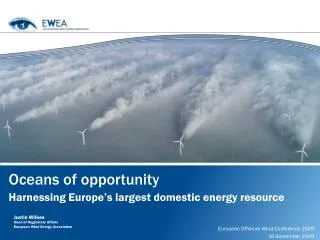
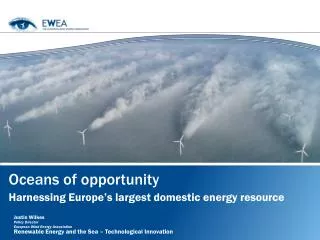
Oceans of opportunity Harnessing Europe’s largest domestic energy resource Justin WilkesPolicy Director European Wind Energy Association Renewable Energy and the Sea – Technological Innovation
Outline • The offshore wind power market • Building the European offshore grid • Technology & supply chain • turbines • substructures
Outline • The offshore wind power market • Building the European offshore grid • Technology & supply chain • turbines • substructures
Global cumulative wind power capacity 1990-2007 (MW) Offshore wind can power Europe seven times over • Technical potential of offshore wind • 25,000 TWh by 2020 • 30,000 TWh by 2030 • EU energy demand • 3,537 TWh by 2020 • 4,279 TWh by 2030 Source: European Environment Agency
2009 installations • 2009 offshore wind market figures EU+Norway • 201 turbines intstalled in 2009 • 584 MW • Increase of 56% compared to 2008
Cumulative analysis EU and Norway • By end 2009: • 830 wind turbines installed & grid connected; • totalling 2,063 MW; • across 39 wind farms; • in 9 European countries.
Outlook • 2010 Expectations • 1000 MW to be installed • 71% market growth • Over 100 GW in pipeline, of which: • 60 GW in government concession/development zones • 52 wind farms fully consented, totalling 17,600 MW • 16 wind farms under construction totalling 3,500 MW
Global cumulative wind power capacity 1990-2007 (MW) Offshore wind energy market in the EU 2011 – 2020 (MW) • 2011: annual installations of 1.5 GW • 2020: annual installations of 6.9 GW • 2020: cumulative installations of 40 GW Source: EWEA 2009
Global cumulative wind power capacity 1990-2007 (MW) Offshore wind energy market in the EU 2021 – 2030 (MW) • 2021: annual installations of 7.7 GW • 2030: annual installtions of 13.6 GW • 2030: cumulative installations of 150 GW Source: EWEA 2009
Project pipeline: Spain & Portugal • Online: 0 MW • Current pipeline: • Spain: 6,708 MW • Portugal: 301 MW Source: EWEA 2009
Global cumulative wind power capacity 1990-2007 (MW) Offshore development – deeper and further Development of the offshore wind industry in terms of water depth (m) and distance to shore (km) in the 2025 timeframe Source: EWEA 2009
Outline • The offshore wind power market • Building the European offshore grid • Technology & supply chain • turbines • substructures
Global cumulative wind power capacity 1990-2007 (MW) EWEA’s 20 year offshore network development plan • Based on: • Existing TSO plans • TradeWind scenarios • Added value of plan: • - Provides step by step timetable for grid development • Suggested capacities • Integrated with development/concession zones
Global cumulative wind power capacity 1990-2007 (MW) EWEA’s 20 year offshore network development plan Source: EWEA 2009
Outline • The offshore wind power market • Building the European offshore grid • Technology & supply chain • turbines • substructures
Technology & Supplychain – main questions • 10,000 turbines: Which type? Who manufactures them? • 10,000 substructures: Whichtechnology? • 10,000 systems: Whichboats? • 10,000 heavyelements to store: Whichharbours?
Outline • The offshore wind power market • Building the European offshore grid • Technology & supply chain • turbines • substructures
Wind Turbines: 3 Benchmarks • 2+ MW (2000) • Siemens • Vestas • Nordex (test) • 3+ MW (2004) • GE (3.6 MW) • Siemens (3.6 MW) • Vestas • WinWind • 5 MW (2007) • Repower • BARD • ArevaMultibrid
Global cumulative wind power capacity 1990-2007 (MW) turbine innovation trends • Main driver for innovation is global economic efficiency, not only generator size • Drivers: • Existing designs: Improving turbine reliability, accessibility, efficiency • Upscaling: Economies of scale are foreseen with larger machines, but installation? Transportation? • New concepts: Innovative concepts variable speed / direct drive are in demo phase, and dedicated offshore designs emerge
Wind turbines: outlook • Upscaling • Siemens - 6 MW • GE - 4 MW • Repower - 6 MW • BARD – 6.5 MW • Vestas – 6 MW • Future entrants • Clipper - 7.5 MW/10 MW • Mitsubishi - 6 MW • Acciona - 3 MW • Gamesa - 4.5 MW • Sinovel – 3 MW • - Doosan - 3 MW • STX (Harakosan) - 2 MW • XEMC Darwind – 5 MW
Outline • The offshore wind power market • Building the European offshore grid • Technology & supply chain • turbines • substructures
Global cumulative wind power capacity 1990-2007 (MW) Supply chain – substructures (present) Current market players • Substructures represent significant proportion of costs • No standard design • Manufacturing industry developed by oil and gas industry – manufacturing capacity has to improve • Integrated approach: supply of substructures, transport and installation • New designs and/or improved manufacturing processes crucial for improved economics Source: MAKE Consulting 2009, own elaboration
Global cumulative wind power capacity 1990-2007 (MW) Supply chain – substructures (future) Source: Carbon Trust
The backbone of Europe’s energy future, Grids 2010, 23 - 24 November 2010
Move ahead of the energy curve, Offshore 2011, 29 November - 1 December 2011
Thank you very much for your attention www.ewea.org/offshore RENEWABLE ENERGY HOUSE 63-65 RUE D’ARLON B-1040 BRUSSELS T: +32 2 546 1940 F: +32 2 546 1944 E: ewea@ewea.org