Download
1 / 18
180 likes | 202 Views
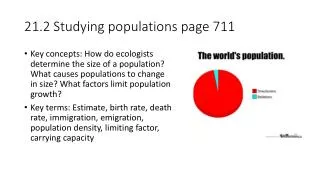
Learn about methods to determine population size, factors affecting population dynamics, and how changes in birth rates, death rates, immigration, and emigration impact populations. Understand how limiting factors such as food, water, space, and weather conditions influence population growth. Discover the importance of population density and carrying capacity.

E N D
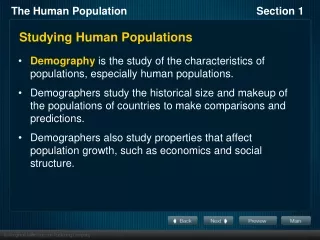
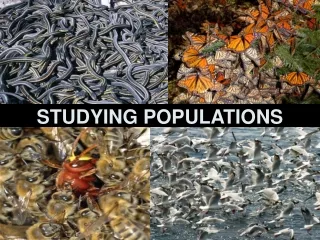
DETERMINING POPULATION SIZE • Some methods of determining the size of a population are direct and indirect observations, sampling and mark-and-recapture studies.
Direct Observation • The most obvious way to determine the size of a population is to count all of its members. Ex. Counting all of the crabs in a tide pool.
Indirect Observation • Sometimes it is easier to observe signs of organisms rather than the organisms themselves. Ex. Examining mud nests built by cliff swallows (birds). The average swallow nest is home to four birds (two parents, two offspring). Multiply that by how many nests there are, and you have the population.
Sampling • Sometimes it is not possible to count sings of every member of a population. The population may be spread over a wide area. In cases like this you make an estimate- an approximation of a number based on reasonable assumptions. Ex. Counting birch trees in a small area, then multiplying to find the number of birch trees in a larger area.
Mark-and-Recapture Studies • Ex. Turtles in a bay are caught in a way that does not harm them. Ecologists count the turtles and mark each shell with a dot of paint before releasing it. Two weeks later, the ecologists return and capture turtles again. They count the turtles with dots (showing that they have been recaptured), and how many are unmarked. Using a mathematical formula, the ecologists can estimate the total population of turtles in the bay.
CHANGES IN POPULATION SIZE • Populations can change in size when new members join the population or when members leave the population. KNOCK KNOCK! I’M HERE…
Births and Deaths • The birth rate of a population is the number of births in a population in a certain amount of time. • Ex. A population of 100 rabbits produces 600 young in a year. The birth rate in this population would be 600 per year.
The death rate is the number of deaths in a population in a certain amount of time. • Ex. If 400 rabbits die in a year in the population, the death rate would be 400 rabbits per year.,
The Population Statement • When the birth rate in a population is greater than the death rate, the population will increase. This can be written as a mathematical statement using the "greater sign." (If birth rate > death rate, population size increases) • If the death rate in a population is greater than the birth rate, the population will decrease. This can also be written as a mathematical statement. (If death rate > birth rate, population size decreases)
Immigration and Emigration Can I come in? • Immigration means moving into a population. Ex. Moving into a new town. • Emigration means leaving a population. Ex. Moving out of your town. See ya… I’m outta here!
Graphing Changes in a Population • Changes in a population's size can be displayed on a line graph. The y axis should show the number of organisms in the population, which the x axis shows time (years). # of organisms years
Population Density • The number of individuals in an area of a specific size. Population Density = Number of individuals Unit Area
LIMITING FACTORS • A limiting factor is an environmental factor that causes a population to decrease. Some limiting factors for populations are food and water, space, and weather conditions. water weather food Space
Food and Water • Since food and water are often in limited supply, they are often limiting factors. • Ex. A giraffe needs to eat 10 kilograms of leaves each day. If trees in an area can provide 100 kilograms of leaves a day while remaining healthy, five giraffes could easily live in this area. But 15 giraffes could not survive there.
The largest population that an area can support is called its carrying capacity.
Space • All organisms need space to live. • Ex. If too many trees are in one area, new trees will have a difficult time growing because the other trees will block too much of the sunlight.
Weather • Weather conditions such as temperature and the amount of rainfall can also limit population growth. • Ex. A hurricane or flood could wash away nests and burrows. A cold spell in late spring can kill the young of many species of organisms, including birds and mammals.