Download
1 / 2
160 likes | 577 Views
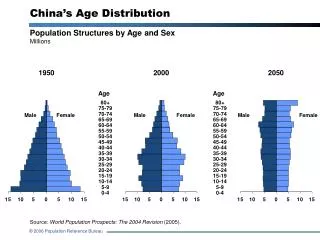
China’s Age Distribution. Population Structures by Age and Sex Millions. 1950. 2000. 2050. Age. Age. 80+ 75-79 70-74 65-69 60-64 55-59 50-54 45-49 40-44 35-39 30-34 25-29 20-24 15-19 10-14 5-9 0-4.

E N D
China’s Age Distribution Population Structures by Age and Sex Millions 1950 2000 2050 Age Age 80+ 75-79 70-74 65-69 60-64 55-59 50-54 45-49 40-44 35-39 30-34 25-29 20-24 15-19 10-14 5-9 0-4 80+ 75-79 70-74 65-69 60-64 55-59 50-54 45-49 40-44 35-39 30-34 25-29 20-24 15-19 10-14 5-9 0-4 Male Female Male Female Male Female Source: World Population Prospects: The 2004 Revision (2005).
Notes on China’s Age Distribution • This figure illustrates China’s shrinking young and working-age population and growing elderly population. • Dramatic fertility decline (due to the success of the “one-child” policy) and improved longevity over the past two decades are causing China’s population to age at one of the fastest rates ever recorded. • China now faces the prospect of having too few children to support its rapidly aging population. Meeting the health and long-term care needs of this growing elderly population will result in soaring health care costs and fewer working-age people to share the burden.