Download
1 / 26
260 likes | 383 Views
Modeling Truck Route Choice Behavior by Traffic Electronic Route Information Data for Oversize / Overmass Vehicles. 0. Background Generating information of truck route choice with electronic route information data for oversize/overmass vehicles

E N D
Modeling Truck Route Choice Behavior by Traffic Electronic Route Information Data for Oversize / Overmass Vehicles • 0. Background • Generating information of truck route choice with electronic route information data for oversize/overmass vehicles • Truck route assignment model using the electronic route data • Proposals for analysis of route choice by sea container trailers Innovations in Freight Demand Modeling and Data Sep.14-15, 2010 Tetsuro HYODO Tokyo University of MarineScience and Technology Yasukatsu HAGINO Institute of BehavioralSciences, JAPAN
OUTLINE Oversize/Overmass vehicles (including 20 ft, 40ftsea containers) must get permission From 2004, online application system started.It is simple GIS based internet system The huge application data (route of each vehicle)are collected automatically (over 1 million per year) How to use them for effective policy measuresor understanding of truck behavior
0. Background 高速道路 一般道路 Needs of road network for increasing sea containers and guiding container traffic ・In 2006, Ministry of Land, Infrastructure, Transport (MLIT) announced “International Freight Arterial Network” to smooth international freight container trailers, and tries to remove traffic barriers. Expressway Ordinary road “International Freight Arterial Network”
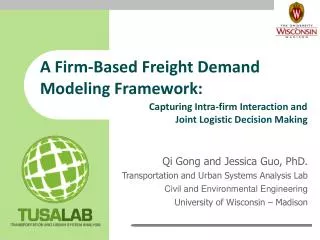
1. Generating information of truck route choice with electronic route information data Vehicle width, length, height Vehicle weight, axle weight, wheel lord, etc. vehicle weight 20t Turning circle (1) Electronic route information data for oversize/overmass vehicles - Roads are built according to structural standards. Road Act specifies maximum size and weight of vehicle called “general limit.” - Vehicles exceed general limit in length, height, or weight are called “oversize/overmass vehicles.” They require permit to drive on roads. General limit of vehicles
Designated heavy truck network in TMR (20 – 25 ton)
Designated high cube container network in TMR (3.8 – 4.3 m)
1. Generating information of truck route choice with electronic route information data Number of Issuance Number of vehicles • 2005 2006 2007 2008 Permit for oversize/overmass vehicles - Oversize/overmass vehicles are required to apply for a permit to road operators to drive on roads. - “Online application system” was introduced in Regional Development Bureaus of the Ministry in March, 2004. ■ Number of issued Permissions ■ Online Application System Office of Permit Bank 3. Confirm payment 1. Apply 2. Fee payment 4. Permit issuance Applicant (home, office)
1. Generating information of truck route choice with electronic route information data Electronic route information data for oversize/overmass vehicles Following tables are the layouts of electronic data, route data, vehicle type, and freight category of permit application Layout of electronic route information data for oversize/overmass vehicles Layout of route information data corresponding to intersection codes
1. Generating information of truck route choice with electronic route information data Types of oversize/overmass vehicles by vehicle category
1. Generating information of truck route choice with electronic route information data Intersection on electronic route information data Node on DRM Road network on electronic route information system Network on DRM Generating information of truck route choice with electronic route information data Intersection codes of electronic route information were matched to DRM node data. Next, truck route data were reproduced on DRM by searching routes on DRM and connecting intersections of electronic route information. There are more than one routes between two points on DRM. We assumed the applicant selected route A since either point is on route A. Route A Intersection of route A with B Route B Intersection of route A with D Route C Route D
1. Generating information of truck route choice with electronic route information data 凡例 利用なし2.5万トン未満/年2.5万トン/年~7.0万トン/年7.0万トン/年~20.0万トン/年20.0万トン以上/年 Converting number of applications to road traffic volume (ton-km) • Number of electronic applications was converted to ton-km using statistics of Surface Import/Export Freight Survey. • Conversion factor for “tonnage per application” was calculated using int’l container traffic data. Estimated international sea containers 20 mill. ton/year 10 mill. ton/year 5 mill. ton/year Legend no traffic less than 25,000 ton/year 25,000 – 70,000 ton/year 70,000 – 200,000 ton/year Over 200,000 ton/year Location of ports covered for international sea containers Annual ton-km for sea container trailers
1. Generating information of truck route choice with electronic route information data Analysis of freight flow using electronic route information data Share of application for international sea containers by travel distance (2005-2007) % Approximately 20% of container trailers drive "500km and over." (international sea container case) distance (km: origin to destination)
1. Generating information of truck route choice with electronic route information data Analysis of freight flow using electronic route information data Distance (km) Share of international sea containers by travel distance and road type (2005) 13
1. Generating information of truck route choice with electronic route information data 凡例 利用なし2.5万トン未満/年2.5万トン/年~7.0万トン/年7.0万トン/年~20.0万トン/年20.0万トン以上/年 Tonnage of international sea containers (in central Tokyo) International freight arterial network is consisted of expressways and trunk national roads. Roads in center of metropolitan are not designated for preserving living environment. However, according to the data generated in this study, it was clear that container trailers drive ordinary roads in Tokyo city center given that Tokyo Port is in the vicinity. International freight network Pref. roads and higher standard roads Route4 Legend no traffic less than 25,000 ton/year 25,000 – 70,000 ton/year 70,000 – 200,000 ton/year Over 200,000 ton/year Tonnage of international sea containers (Int’l freight arterial and other roads, annual )
2. Truck route choice model using electronic route information data Examined route choice models Route choice models for sea container trailers using traffic flow of those container trailers generated with application data. Two different techniques were examined: Maximum Overlapping Ratio (MOR) model, and modified Dial technique (“Path Size Dial Logit: PSDL model) which is one of multiple-route assignment techniques. Because of time limitation, only MOR model will be explained.
Objective Function=How to maximize the “Overlapping Ratio” Concept of “Maximum Overlapping Ratio (MOR) model” Recognized distance highway Route Overlapping Ratio: Actual route Shortest Path Estimated Path If the each link length = 1 … [Overlapping length] [Actual Length] 3 5 = 0.60 =
Formulation of MOR model Definition of “Cognitive Distance” Assumption: “Recognized link distance is varied by the conditions of link” 1 0 :Recognized distance :Actual distance 0.8 0.6 :Parameter 80[m]= 100[m] ×0.81 ×0.60 :Dummy variable (0 or 1) Actual distance:100m Recognized distance:80m
ω:Value of Time :Rec. G. Cost :Parameter :Driving Cost :Dummy variable :Driving Time Formulation of MOR model Applying “Recognized Generalized Link Cost” instead of “Recognized link distance” Generalized Cost Actual Dist. Rec. Dist.
Formulation of MOR model Definition of “Overlapping Ratio” (Objective Func.) :Overlapping Ratio :Overlapped distance between estimated & actual path :Actual distance
Objective function of MOR model can not be differentiated by parameters Genetic Algorithm is applied (20 genes, 7 bits, 50 generations) Min=0, Max=1, (20+25)*(1/27)=0.25 26 25 24 23 22 21 20 Min=10, Max=100, (21+23)*(90/27)+10=17.0 26 25 24 23 22 21 20 How to evaluate the dispersion of estimated parameters ? “Bootstrap method” is applied (100 sets are examined)
Result of Parameter Estimation * Link is designated for heavy truck (over 20t)=1, otherwise=0 ** Link is designated for height container (over 3.8m)=1, otherwise=0
Contour of objective function by100 Bootstrap sets (VOT & “Heavy” case) Value of Time Weight designated road dummy
2. Truck route assignment model using electronic route information data Central Circular Route Metro. Inter- city Exp. Narita Airport Inner Circular Route Haneda Airport Policy simulation using truck route assignment model Change in traffic flow was estimated using route choice model for sea container trailers established in this study, assuming that roads are to be developed in the future. Three belt ways in Tokyo Region
2. Truck route assignment model using electronic route information data By completing three belt ways, sea container trailer flow would decrease significantly in central Tokyo, as well as CO2 emission. Change in CO2 emission (t-CO2 / year) Change in traffic by completing three belt ways (annual) [with three ring roads – without three ring roads]
3. Proposals for analysis of route choice by maritime container trailers (1) Achievement to date 1) Developed a method to generate truck route choice data using electronic route information data for oversize/overmass vehicles 2) Learned actual freight flow such as “flow on international freight arterial network” 3) Reproduced truck route data on network for assignment, and generated basic data for quantitative analysis such as establishing truck route choice model. (2) Future possibilities 1) Building time-series truck route data by continuous data generation Period of traffic permit is one year. By generating continuous data, flexible route analysis will be possible with fuel cost, economy, toll discount, etc. 2) Apply data to further truck route choice model Utilizing extensive data enables highly accurate validation of model reproduction which could be applied to further multiple-route choice model. 3) Utilize on policy evaluation 25