Freight Demand Modeling Using Econometric Models
Freight Demand Modeling Using Econometric Models. Sept 14, 2010. Econometric Models…. Use regression based approaches to estimate demand Typical statistical techniques used are - Ordinary Least Squares (OLS) - Panel Models

Freight Demand Modeling Using Econometric Models
E N D
Presentation Transcript
Freight Demand Modeling Using Econometric Models Sept 14, 2010
Econometric Models…. • Use regression based approaches to estimate demand • Typical statistical techniques used are - Ordinary Least Squares (OLS) - Panel Models - Others (Two Stages, etc) • Use historical data
Are particularly useful when… • Long period of historical data exists • Socio-economic factors are important, for example at a major interstate with significant proportion of thru-traffic • No significant network changes are expected (e.g. competing route construction)
Advantages of Econometric Models • Easy to develop and estimate • Simulation of economic variables, toll and other scenarios can be developed in a statistically rigorous way • Relatively inexpensive to update and recalibrate
Disadvantages of Econometric Models • Theoretically relevant independent variables can be highly correlated (multi-collinearity) • Assumption that historical data is a good predictor of future trends (tenuous when structural change might be taking place)
Typical Model Structure • ….generally consists of… Truck Transactions / AADT = f (tolls, diesel prices, economic factors (e.g. employment, industrial production, inventory accumulation, inventory sales ratios), seasonal dummies, special one-off events)
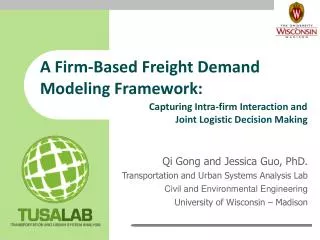
Michigan / Canada Border Crossing An Example Application
Michigan / Canada Border Crossing • Freight Corridor model of Ambassador and Blue Water Bridges
Independent Demand Drivers • Diesel Price • Foreign Exchange Rate • US Industrial Production • US Inventory Sales Ratios • US Light Vehicle Sales • Seasonal Dummies • Blue Water Deck Replacement
The Challenges… Correlation =0.9 High Correlation between Foreign Exchange Rate and Diesel Price Solution: Principal Component Analysis
Principal Component Analysis • Used to address high correlation of independent variables (or multi-collinearity) • Technique captures “underlying” trend of the data (by computing a weighted average) • Derived components are uncorrelated to each other
Why do we use Principal Component Techniques here? • Reduce multi-collinearity between Diesel Price and the exchange rate • Incorporate more information: Principal component is derived for Inventory Sales Ratio (wholesale, retail, manufacturing, total business)
Model Results • Sample 1995Q3 – 2007 Q4
Do the Models Forecast the Recession? • Models Backcast very well with MAPE of 2.3% for Inventory based models • For the naïve GDP model MAPE of 7.5%
New York State Thru-way An Example Application
The New York Thru-way Model • Models estimated for different sections of the New York State Thruway • In particular models focus on sections near Buffalo and Lake Eerie, providing connections across the border into Canada
Panel Models • Panel Models are estimated for different sections of the New York State Thruway • Panel models are jointly estimated for a common set of coefficients • Fixed effect methods control for section specific (unobserved) characteristics
Model Specification • Inventory Sales Ratio Principal Component (includes retail, manufacturing, wholesale, total) • Industrial Production • US Diesel Prices • Monthly dummies and other event dummies
Conclusions • Inventory based models work well and value compared naïve models based on a broad based macro-economic indicator • Principal component techniques can be successfully used to address multicollinarity issues • When well calibrated, econometric models can successfully capture even unprecendent declines in activity