Download
1 / 49
500 likes | 737 Views
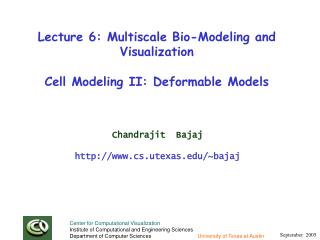
Lecture 6: Multiscale Bio-Modeling and Visualization Cell Modeling II: Deformable Models. Chandrajit Bajaj http://www.cs.utexas.edu/~bajaj. Cell Bio-Mechanics. How does a cell maintain or change shape ? How do cells move ?

E N D
Lecture 6: Multiscale Bio-Modeling and VisualizationCell Modeling II: Deformable Models Chandrajit Bajaj http://www.cs.utexas.edu/~bajaj Center for Computational Visualization Institute of Computational and Engineering Sciences Department of Computer Sciences University of Texas at Austin
Cell Bio-Mechanics • How does a cell maintain or change shape ? • How do cells move ? • How do cells transport materials internally ? What mechanisms and using what forces ? • How do cells stick together ? Or avoid adhering ? • What are stability limits of cell’s components ? Center for Computational Visualization Institute of Computational and Engineering Sciences Department of Computer Sciences University of Texas at Austin
Cell’s Structural/ Chemical Elements • Fluid Sheets (membranes) enclose Cells & Organelles • Networks of Filaments maintain cell shape & organize its contents • Chemical composition...has an evolutionary resemblance (e.g. actin found in yeast to humans) Center for Computational Visualization Institute of Computational and Engineering Sciences Department of Computer Sciences University of Texas at Austin
Biological Motivation Many biological processes at the cellular level involve the interaction of deformable interfaces. The deformation and interaction of cells is fundamental in many biological functions and processes. Any process involving cell motility involves deformation of the cell membrane. endocytosis/exocytosis mitosis – cytokinesis cell-cell interaction http://faculty.uca.edu/~johnc/MEMBRANE.htm • http://www.hopkinsmedicine.org/cellbio/robinson/ Goal • Accurate modeling, simulation, and visualization of such phenomena Center for Computational Visualization Institute of Computational and Engineering Sciences Department of Computer Sciences University of Texas at Austin
Baker’s Yeast: Saccharomyces Cerevisiae • a & b: cytoplasm • c: nuclear membrane • d: nuclear matrix • e: nuclear pore • f & g: mitochondrion • h: endoplasmic reticulum • i: golgi apparatus • j: coated vesicle • k: vacuole Center for Computational Visualization Institute of Computational and Engineering Sciences Department of Computer Sciences University of Texas at Austin
Cytoplasm: Cytoskeleton microtubule Cytoskeleton Yeast cytoplasm is crisscrossed with structural filaments, together forming the cytoskeleton. actin filament Intermediate filament Center for Computational Visualization Institute of Computational and Engineering Sciences Department of Computer Sciences University of Texas at Austin
Cytoplasm: Protein Synthesis actin filament Intermediate filament Protein synthesis Underway in the cytoplasm. The machinery of translation, consisting of ribosomes, tRNA and tRNA synthetases, builds proteins from mRNA in the cytoplasm. Ribosomes line tRNA molecules along the mRNA strand and links up amino acids. Center for Computational Visualization Institute of Computational and Engineering Sciences Department of Computer Sciences University of Texas at Austin
Mitochondria: power generators Outer membrane Inner membrane Mitochondrial Membranes • two concentric membranes Energy-producing protein Pore-forming protein cytoplasm Center for Computational Visualization Institute of Computational and Engineering Sciences Department of Computer Sciences University of Texas at Austin
Mitochondrial Interior Mitochondria are filled to their limit with proteins, ribosomes, and nucleic acids. Inner membrane Pyruvate dehydrogenase complex: enzyme that links glycolysis with the citric acid cycle by converting pyruvate to acetyl-CoA. Center for Computational Visualization Institute of Computational and Engineering Sciences Department of Computer Sciences University of Texas at Austin
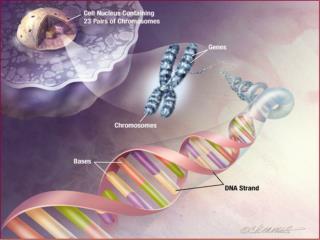
Nucleus: library A double nuclear membrane Cytoplasm • Functions of nucleus • Storing the delicate strands of DNA and protecting them from the rigors of the cytoplasm • Where transcription of DNA into mRNA performed • Specialized in archiving, reading, and regulating the use of info held in DNA Nuclear interior DNA Center for Computational Visualization Institute of Computational and Engineering Sciences Department of Computer Sciences University of Texas at Austin
Nuclear Interior RNA polymerase molecules DNA Center for Computational Visualization Institute of Computational and Engineering Sciences Department of Computer Sciences University of Texas at Austin
Nuclear Pore Nuclear pore A complex of mRNA and protein is seen emerging through the elaborate gate of proteins. Because of the large size of the pore complex, only four of the eight symmetric gate elements fit into the image. Center for Computational Visualization Institute of Computational and Engineering Sciences Department of Computer Sciences University of Texas at Austin
Endoplasmic Reticulum Ribosomes bind to special transport proteins in the endoplasmic reticulum membrane. The newly built proteins are guided inside the endoplasmic reticulum. The proteins inside have begun their journey to the vacuole or cell surface. Center for Computational Visualization Institute of Computational and Engineering Sciences Department of Computer Sciences University of Texas at Austin
Golgi Apparatus When proteins pass through the stacked disks of Golgi apparatus, they are successively modified and sorted. Long polysaccharides are added to membrane proteins and small digestive enzymes are gathered by membrane-bound sorting proteins. Protein journey path Center for Computational Visualization Institute of Computational and Engineering Sciences Department of Computer Sciences University of Texas at Austin
Coated Vesicle After passing through Golgi apparatus, proteins are transported to their ultimate destination in small vesicles. Triskelions associate into a geodesic structure on the surface of the Golgi apparatus membrane and pull off vesicles. triskelion Center for Computational Visualization Institute of Computational and Engineering Sciences Department of Computer Sciences University of Texas at Austin
Vacuole The vesicle dumps its cargo of digestive enzymes and membrane proteins after reaching the vacuole. Interior of the vacuole Center for Computational Visualization Institute of Computational and Engineering Sciences Department of Computer Sciences University of Texas at Austin
Deformable Bodies Two Droplets in Shear Flow INITIAL BUBBLE RADIUS: 1.5 cm Capillary Number = 3.0 Viscosity ratio = 1.0 Surface tension = 1.5 dynes/cm^2 Flow Rate = 1.0 /s Center for Computational Visualization Institute of Computational and Engineering Sciences Department of Computer Sciences University of Texas at Austin
Interface Dynamics I Parameters • A simplistic model for these phenomena utilizes Stokes equations for two-phase flow Stokes equation describes slow, viscous, steady flows characterized by low Reynolds number. Can also be used to model quasi-steady flow in which flow changes due to changing boundary interfaces Center for Computational Visualization Institute of Computational and Engineering Sciences Department of Computer Sciences University of Texas at Austin
Interface Dynamics II • Consider closed interfaces (droplets) that are immersed in a viscous fluid Boundary Conditions • velocity is continuous Stress defined as • stress is discontinuous is a model dependent term: could include effects from surface tension, gravity or other body forces, or membrane elasticity Center for Computational Visualization Institute of Computational and Engineering Sciences Department of Computer Sciences University of Texas at Austin
Interface Dynamics III Boundary Integral Formulation • For interfacial dynamics in Stokes flow an integral representation is used to represent the velocity at the boundary EQN(*) [5] C. Pozrikidis. 2000 Green’s Functions Center for Computational Visualization Institute of Computational and Engineering Sciences Department of Computer Sciences University of Texas at Austin
Algorithm Sketch • Specify an initial configuration and implicit representation of interfaces. Initialize fluid parameters and surrounding flow • Extract a “quality” adaptive mesh of the interface • Use a BEM to calculate interfacial velocities and analyze associated errors. • Check Oracle for topology change and modify implicit function if topology change should occur. • Evolve interface based on interfacial velocities • Check for geometric interference and adjust interface evolution if necessary. • Iterate steps 2 to 6 till stopping criterion is satisfied Center for Computational Visualization Institute of Computational and Engineering Sciences Department of Computer Sciences University of Texas at Austin
Algorithm Sketch • Details 1. velocity computation 2. quality meshing & refinement 3. topology control 4. interface update 5. interference check Center for Computational Visualization Institute of Computational and Engineering Sciences Department of Computer Sciences University of Texas at Austin
0. Initial Configuration • Setup initial interfaces as linear boundary element contour mesh M of an implicit function • M provides the following: • Vertex positions • Face Connectivity • Vertex Normals • Mean Curvatures at vertices • Minimum vertex list • Fluid parameters: Center for Computational Visualization Institute of Computational and Engineering Sciences Department of Computer Sciences University of Texas at Austin
1. Velocity Computation I Boundary Element Method • Surface mesh representing the boundary is created • We attach a discretized EQN(*) at each vertex of the mesh • We are left with a linear system which we solve for the interfacial velocities at the mesh vertices vertices of the mesh serve as boundary element nodes where velocities are computed Center for Computational Visualization Institute of Computational and Engineering Sciences Department of Computer Sciences University of Texas at Austin
1. Velocity Computation II • Calculate the velocities at each vertex by iterating • Start vectors for the iteration can be derived from previously computed boundary element velocities. • Previously computed velocities are used in the integral on the right hand side for each iteration. Iteration is done until a convergence criteria is met. Center for Computational Visualization Institute of Computational and Engineering Sciences Department of Computer Sciences University of Texas at Austin
Velocity Computation II:Error Estimation • Flow is incompressible so we can check that velocity is divergence free • This also means that volume is preserved so we can calculate it, and check that its change is within acceptable tolerance • A rough measure of local error can be made if we calculate the following quantity at each face, • is the velocity calculated from the boundary element method linearly interpolated to the quadrature point and is taken to as the face average of the velocities at the vertices. • The quantity gives us a measure of the variation of the velocity over each face. If this does not meet a specified tolerance then that face can be refined. Center for Computational Visualization Institute of Computational and Engineering Sciences Department of Computer Sciences University of Texas at Austin
2. Quality Quad Meshing • Extending the dual contouring method to adaptive and quality quad/hex meshing • The selection the starting octree level to guarantee the correct topology • Crack-free and adaptive quad/hex meshing without hanging nodes • Using geometric flows to improve mesh quality • Mesh Adaptivity • Feature sensitive error function • Various areas users are interested in • Finite element solutions (bubble) • User defined Template : • References: • Y. Zhang, C. Bajaj. Adaptive and Quality Quadrilateral/Hexahedral Meshing from Volumetric Data. Computer Methods in Applied Mechanics and Engineering (CMAME), in press, 2005. • Y. Zhang, C. Bajaj. Adaptive and Quality Quadrilateral/Hexahedral Meshing from Volumetric Data. 13th International Meshing Roundtable, pp365-376, 2004. Center for Computational Visualization Institute of Computational and Engineering Sciences Department of Computer Sciences University of Texas at Austin
3. Topology Control I : Function and Mesh Refinement • Octree refinement & coarsening Contouring • Coarsening : remove high-frequency and change topology in close areas < Up-Sampling > < Down-Sampling > Center for Computational Visualization Institute of Computational and Engineering Sciences Department of Computer Sciences University of Texas at Austin
3. Topology Control II: Oracle Topology Decision • We invent an “Oracle” to determine whether topology change occurs during simulation. • If two interfaces or two non-local regions of one surface are close enough within a distance bound, we assume the close regions are in a contact status. • An octree spatial decomposition is used to identify contact regions. • The Oracle’s implementation and how it handles this contact status can be changed depending on the specific problem being modeled. The Oracle basically provides three outputs: • No Change • Coalescence • Breakup <no topology change> Center for Computational Visualization Institute of Computational and Engineering Sciences Department of Computer Sciences University of Texas at Austin <coalescence>
4. Interface Update I:TimeStep Restriction • Once velocities are computed at the vertices of the mesh and the Oracle is satisfied we advect using For stability the timestep is taken as is the minimum size of a face on the mesh and K is a O(1) constant taken to be 0.5 [7] Rallison `81 Center for Computational Visualization Institute of Computational and Engineering Sciences Department of Computer Sciences University of Texas at Austin
4. Interface Update II:Semi-Lagrangian Level Set Method • The interface is passively advected with the interface velocities by updating the level set data with the ‘level set equation’ • The level set data is stored in an octree data structure • To find the new value of the level set at the grid point located at we find the point that maps into by evolving backward with the velocity • Trace the point backward one timestep to find the location that maps to it. • Interpolate from neighboring cells to find the value at this point. The old value at y is the new value at x Center for Computational Visualization Institute of Computational and Engineering Sciences Department of Computer Sciences University of Texas at Austin
4. Interface Update II: Velocity Extension & Redistancing • Lift velocity to nearest grid points by finding the closest point on the mesh and then interpolating velocity from surrounding vertices. • Once grid points of cells intersecting the interface have velocities, march outwards from the interface solving for F in the following equation. • F is a speed normal to the interface. Reinitialization of level set data to a signed distance function is also done as we march outwards by solving Center for Computational Visualization Institute of Computational and Engineering Sciences Department of Computer Sciences University of Texas at Austin
5. Interference Checking: Topology and Remeshing • Interfacial Remeshing during a Droplet Coalescence Center for Computational Visualization Institute of Computational and Engineering Sciences Department of Computer Sciences University of Texas at Austin
Flow Scenarios • To observe interesting effects in bubble dynamics such as drop break up, drop coalescence, and drop slippage, initially spherical drops are embedded within various Stokes flows. Some common flows are the following, Straining Flows • Straining flows act to pull apart the droplet. Shearing Flows Convergent Flows • Convergent flows are the opposite of straining flows in that they tend to squeeze droplets together Determines strength of the flow (r,z) are cylindrical coordinates Center for Computational Visualization Institute of Computational and Engineering Sciences Department of Computer Sciences University of Texas at Austin
Coalescence • Coalescence can occur if two droplets are placed in a convergent flow and allowed enough time for the thin fluid film between the drops to be drained. • Non-hydrodynamic effects such as Van der Waals forces are only relevant at the moment of interface rupture. • The dynamics of coalescence up to this point can be understood solely from the hydrodynamics. • The strength of the asymptotic Stokes flow determines the rate at which the thin fluid film is drained Center for Computational Visualization Institute of Computational and Engineering Sciences Department of Computer Sciences University of Texas at Austin
Breakup • Drop breakup can occur in shearing and straining flows as well as buoyancy driven motion. • Breakup is governed by three dimensionless physical parameters: capillary number, Bond number, viscosity ratio R = undeformed drop radius. Other quantities are as they have been defined previously • The capillary number, Ca, governs drop breakup in shearing flow. Breakup will occur after long enough time when Ca = O(1). • In buoyancy driven motion, Bo is the parameter which governs drop breakup. When Bo = O(1) then gravity-induced drop breakup can occur. Center for Computational Visualization Institute of Computational and Engineering Sciences Department of Computer Sciences University of Texas at Austin
Example Scenarios Straining Flow Converging Flow INITIAL BUBBLE RADIUS: .95 cm Capillary Number = 3.8 Viscosity ratio = 1.0 Surface tension = 0.5 dynes/cm^2 Flow Rate = 1.0 /s INITIAL BUBBLE RADIUS: 0.43 cm Capillary Number = .258 Viscosity Ratio = 1.0 Surface Tension = 1.0 dynes/cm^2 Flow Rate = 1.0 /s Center for Computational Visualization Institute of Computational and Engineering Sciences Department of Computer Sciences University of Texas at Austin
Simulation Results Straining Flow Converging Flow Center for Computational Visualization Institute of Computational and Engineering Sciences Department of Computer Sciences University of Texas at Austin
BEM & Meshing References Meshing [1] J. C. Carr, R. K. Beatson, J. B. Cherrie, T. J. Mitchell, W. R. Fright, B. C.McCallum, and T. R. Evans. Reconstruction and representation of 3d objects with radial basis functions. In ACM SIGGRAPH, pages 67–76, 2001. [2] T. Ju, F. Losasso, S. Schaefer, and J.Warren. Dual contouring of hermite data. In Proceedings of SIGGRAPH, pages 339–346, 2002. [3] Leif Kobbelt, Thilo Bareuther, and Hans-Peter Seidel. Multiresolution shape deformations for meshes with dynamic vertex connectivity. volume 19, pages 249– 260, 2000. [4] Jens Vorsatz, Christian Rössl, and Hans-Peter Seidel. Dynamic remeshing and applications. In ACM Symposium on Solid Modeling and Applications, pages 167– 175, 2003. [5] G. Yngve and G. Turk. Robust creation of implicit surfaces from polygonal meshes. IEEE Transactions on Visualization and Computer Graphics, (4):346–359, 2002. [6] Yongjie Zhang and Chandrajit Bajaj. Adaptive and quality quadrilateral/hexahedral meshing from volumetric data. To Appear in Computer Methods in Applied Mechanics and Engineering (CMAME), 2005. [7] Yongjie Zhang, Chandrajit Bajaj, and Bong-Soo Sohn. 3D finite element meshing from imaging data. To Appear in the special issue of Computer Methods in Applied Mechanics and Engineering (CMAME) on Unstructured Mesh generation, 2005. Boundary Element Fluid Simulation [1] Z.A. Zinchenko,M.A. Rother, and R.H. Davis. A novel boundary integral algorithm for viscous interaction of deformable drops. Phys. Fluids, 9:1493–1511, 1996. [2] V. Cristini, J. Blawzdziewicz, and M. Loewenberg. An adaptive mesh algorithm for evolving surfaces : simulations of drop breakup and coalescence. Journal of Computational Physics, 168:445–463, 2001. [3] J.-M. Hong and Kim C.-H. Animation of bubbles in liquid. In In Proceedings of Eurographics 2003, pages 253–262, 2003. [4] M.Loewenberg and E.J. Hinch. Numerical simulation of a concentrated emulsion in shear flow. J. Fluid Mech., 321:395, 1996. [5] C. Pozrikidis. Boundary integral and singularity methods for linearized viscous flow. Cambridge University Press, 1992. [6] C. Pozrikidis. Interfacial dynamics for stokes flow. J. Comp. Phys, 169:250–301, 2000. [7] J.M. Rallison. A numerical study of the deofrmation and burst of a viscous drop in general shear flows. J. Fluid Mech., 109:465–482, 1981. [8] E. Kita and N. Kamiya. A new adaptive boundary element refinement based on simple algorithm. Mech Res Commun., 18(4). [9] J.Tausch. Sparse BEM for potential theory and Stokes flow using variable second order wavelets. Comp. Mech, 1, pp 312--318 2003. [10] J.Tausch. Rapid solution of Stokes flow using multiscale galerkin BEM. PAMM, Proc. Appl. Math. Mech. 1, pp 8-11 2002. Center for Computational Visualization Institute of Computational and Engineering Sciences Department of Computer Sciences University of Texas at Austin
Level Set References • [1] D. Adalsteinsson and J. Sethian. A fast level set method for propagating • interfaces. J. Comp. Phys., 118:269-277, 1995. • [2] D. Enright, R. Fedkiw, J. Ferziger, and I. Mitchell. A hybrid particle • level set method for improved interface capturing. J. Comp. Phys., • 183:83-116, 2002. • [3] D. Enright, S. Marschner, and R. Fedkiw. Animation and rendering of • complex water surfaces. ACM Trans. on Graphics (SIGGRAPH 2002 • Proceedings), 21:736-744, 2002. • [4] S. Osher and R. Fedkiw. Level Set Methods and Dynamic Implicit • Surfaces. Springer-Verlag, New York, 2002. • [5] S. Osher and J. Sethian. Fronts propagating with curvature dependent • speed: Algorithms based on hamiliton-jacobi formulations. J. Comp. • Phys., 79:12-49, 1988. • [6] D. Peng, B. Merriman, S. Osher, H.-K. Zhao, and M. Kang. A pde- • based fast local level set method. J. Comp. Phys., 155:410-438, 1999. • [7] W. Rider and D. Kothe. Reconstructing volume tracking. J. Comp. • Phys., 141:112-152, 1998. • [8] J. Sethian. A fast marching level set method for monotonically advanc- • ing fronts. Proc. Natl. Acad. Sci., 93:1591{1595, 1996. • [9] J. Sethian. Fast marching methods. SIAM Rev., 41:199-235, 1999. • [10] C. Shu and S. Osher. Effcient implementation of essentially non- • oscillatory shock capturing schemes. J. Comp. Phys., 77:439-471, 1988. • [11] J. Strain. Semi-lagrangian methods for level set equations. J. Comp. • Phys., 151:498-533, 1999. • [12] J. Strain. A fast modular semi-lagrangian method for moving interfaces. • J. Comp. Phys., 161:512-536, 2000. • [13] M. Sussman and E. Fatemi. An effcient, interface-preserving level set • redistancing algorithm and its application to interfacial incompressible • fuid fow. SIAM J. Sci. Comput., 20:1165-1191, 1999. • [14] D. Enright, F. Lossasso, R. Fedkiw. 2005. A fast and • accurate semi-lagrangian particle level set method. Computers • and Structures, 83, 479–490. • [15] R. Fedkiw, J. Stam, H.W. Jensen. Visualization of smoke. In Proc. Of ACM SIGGRAPH 2001, 15-22. Center for Computational Visualization Institute of Computational and Engineering Sciences Department of Computer Sciences University of Texas at Austin
Method Overview for MultiphaseCharged, Viscous Fluid Flows Some preliminary Thoughts Center for Computational Visualization Institute of Computational and Engineering Sciences Department of Computer Sciences University of Texas at Austin
Assumptions of the Model • Consider two electrically charged fluids of different viscosities and different dielectrics • Model the hydrodynamics with the Stokes equation which governs viscous flow • Model the electrostatic interaction with Poisson-Boltzmann equation Center for Computational Visualization Institute of Computational and Engineering Sciences Department of Computer Sciences University of Texas at Austin
Governing Equation for Stokes Flow • p is the pressure • u is the fluid velocity • The last term represents a long range body force. For this model this force will be electrostatic. Center for Computational Visualization Institute of Computational and Engineering Sciences Department of Computer Sciences University of Texas at Austin
Poisson-Boltzmann Equation where, B.Honig and A.Nicholls, Science 268, 1144 (1995) Center for Computational Visualization Institute of Computational and Engineering Sciences Department of Computer Sciences University of Texas at Austin
Boundary Element Method • With an explicit representation for the boundary we choose the boundary element method as our numerical solver • We first solve the electrostatic boundary value problem • Use the result to solve the hydrodynamic problem Center for Computational Visualization Institute of Computational and Engineering Sciences Department of Computer Sciences University of Texas at Austin
Overview of solver • Discretize the boundary interface • Assign a charge density to each boundary element on the interface • Solve using a point collocation scheme • Calculate the electrostatic potential at all collocation nodes. Center for Computational Visualization Institute of Computational and Engineering Sciences Department of Computer Sciences University of Texas at Austin
Boundary Traction • The difference in traction at the boundary is given by, The terms are the electrostatic forces per unit volume on the particle and suspending fluid C.Pozrikidis, J. Comp. Phy. 169, 250-301 (2001) Center for Computational Visualization Institute of Computational and Engineering Sciences Department of Computer Sciences University of Texas at Austin
Coupling Electrostatics with Interfacial Dynamics • Having solved for the electrostatic potential via BEM we calculate the electrostatic force per unit volume at each boundary collocation node • This is added to the boundary traction difference • The velocities at points on the boundary are solved via BEM. • The interface is updated Center for Computational Visualization Institute of Computational and Engineering Sciences Department of Computer Sciences University of Texas at Austin
Additional Notes • We may have multiple resolutions of the boundary element mesh: one for the electrostatic BEM solver and another for the hydrodynamic BEM solver. • We could also use finite element or finite difference methods to calculate the electrostatic potential and then couple to the BEM fluid solver. Center for Computational Visualization Institute of Computational and Engineering Sciences Department of Computer Sciences University of Texas at Austin