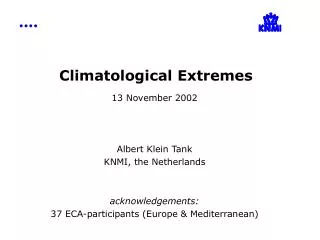
Climatological Extremes
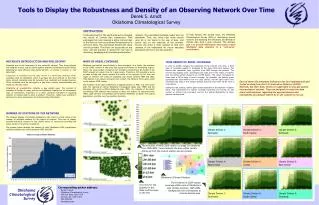
This comprehensive guide explores climate extremes and their repercussions, focusing on definitions, indices, and trends observed between 1946 and 1999 across Europe and the Mediterranean. It highlights event characteristics, societal and economic impacts, and emphasizes the importance of daily temperature and precipitation data. The guide showcases temperature extremes, such as frost and warm nights, and discusses the approaches used for trend detection. Furthermore, it examines how extreme weather events are increasingly significant indicators of climate change, offering insights for future climate impact assessments.

Climatological Extremes
E N D
Presentation Transcript
Climatological Extremes 13 November 2002 Albert Klein Tank KNMI, the Netherlands acknowledgements:37 ECA-participants (Europe & Mediterranean)
Guide • Definition of extremes and the use of indices • Trends (1946-1999) for Europe and the world • ECA&D project and website (demo)
Guide • Definition of extremes and the use of indices • Trends (1946-1999) for Europe and the world • ECA&D project and website (demo)
NO What type of extremes? • Events characterised by the size of their societal or economic impacts • Events characterised by parameters of extreme value distributions • Phenomena with a daily time scale and typical return period < 1 year as indicators of extremes
NO NO What type of extremes? • Events characterised by the size of their societal or economic impacts • Events characterised by parameters of extreme value distributions • Phenomena with a daily time scale and typical return period < 1 year as indicators of extremes
NO NO What type of extremes? • Events characterised by the size of their societal or economic impacts • Events characterised by parameters of extreme value distributions • Phenomena with a daily time scale and typical return period < 1 year as indicators of extremes YES
Approach • Use daily series of observations at meteorological stations throughout Europe and the Mediterranean • Define descriptive indices as proposed by the joint CCL/CLIVAR Working Group on Climate Change Detection (Peterson et al., WMO-TD No. 1071, 2001) • Count the days crossing a threshold; either absolute/fixed thresholds or percentile/variable thresholds relative to local climate
Approach • Use daily series of observations at meteorological stations throughout Europe and the Mediterranean • Define descriptive indices as proposed by the joint CCL/CLIVAR Working Group on Climate Change Detection (Peterson et al., WMO-TD No. 1071, 2001) • Count the days crossing a threshold; either absolute/fixed thresholds or percentile/variable thresholds relative to local climate
Approach • Use daily series of observations at meteorological stations throughout Europe and the Mediterranean • Define descriptive indices as proposed by the joint CCL/CLIVAR Working Group on Climate Change Detection (Peterson et al., WMO-TD No. 1071, 2001) • Count the days crossing a threshold; either absolute/fixed thresholds or percentile/variable thresholds relative to local climate
Example of thresholds in the definition of indices of temperature extremes upper 10-ptile 1961-1990 the year 1996 lower 10-ptile 1961-1990
“frost days” Example of thresholds in the definition of indices of temperature extremes upper 10-ptile 1961-1990 the year 1996 lower 10-ptile 1961-1990
“cold nights” Example of thresholds in the definition of indices of temperature extremes upper 10-ptile 1961-1990 the year 1996 lower 10-ptile 1961-1990
“warm nights” “cold nights” Example of thresholds in the definition of indices of temperature extremes upper 10-ptile 1961-1990 the year 1996 lower 10-ptile 1961-1990
Motivation • The detection probability of trends depends on the return period of the extreme event and the length of the series • For extremes in daily station series with typical length~50 years, the optimal return period is 10-30 days rather than 10-30 years
Motivation • The detection probability of trends depends on the return period of the extreme event and the length of the series • For extremes in daily station series with typical length~50 years, the optimal return period is 10-30 days rather than 10-30 years
Example: 80% detection probability (5% significance level) (see also: Frei & Schär, J.Climate, 2001)
Guide • Definition of extremes and the use of indices • Trends (1946-1999) for Europe and the world • ECA&D project and website (demo)
Trend examples • Extreme indices for temperature related impacts / applications • “Warm” and “cold” extreme indices describing how temperature distributions (pdf’s) shift in time • Extreme indices of heavy precipitation
Trend examples • Extreme indices for temperature related impacts / applications • “Warm” and “cold” extreme indices describing how temperature distributions (pdf’s) shift in time • Extreme indices of heavy precipitation
Trend examples • Extreme indices for temperature related impacts / applications • “Warm” and “cold” extreme indices describing how temperature distributions (pdf’s) shift in time • Extreme indices of heavy precipitation
Heating degree days Growing season (sum of 17°C - TG) length (6 days, TG 5°C)
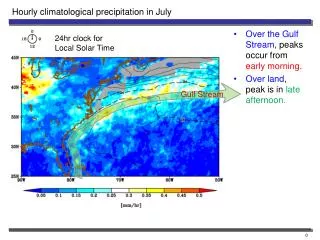
Easterling et al. (BAMS, 2000) in IPCC-TAR see also Groisman et al. (Clim.Change, 1999) Linear trends in rainy season over last ~50 years
Heavy precipitation: R95%tot-index (fraction due to very wet days) 1) Identify very wet days using a site specific threshold = 95th percentile of amounts at wet daysin the 1961-1990 period 2) Determine fraction of total precipitation in each year or season that is due to these days 3) Trend analysis in resulting series
Heavy precipitation: R95%tot-index (fraction due to very wet days) 1) Identify very wet days using a site specific threshold = 95th percentile of amounts at wet daysin the 1961-1990 period 2) Determine fraction of total precipitation in each year or season that is due to these days 3) Trend analysis in resulting series
Heavy precipitation: R95%tot-index (fraction due to very wet days) 1) Identify very wet days using a site specific threshold = 95th percentile of amounts at wet daysin the 1961-1990 period 2) Determine fraction of total precipitation in each year or season that is due to these days 3) Trend analysis in resulting series
Guide • Definition of extremes and the use of indices • Trends (1946-1999) for Europe and the world • ECA&D project and website (demo)
Conclusions and outlook • The standardised descriptive indices (that are based on daily series) reveal trends in climatological extremes for Europe that can directly be compared to the trends in other regions of the world; the indices are adequate for climate change detection as well as for impact assessment • Future plans ECA&D-project: 2006 assessment report, improved daily dataset (coverage / elements / homogeneity / metadata / gridding / web-access), additional participants, communication of results both towards climate change detection and modelling community and towards applied climatology community
Conclusions and outlook • The standardised descriptive indices (that are based on daily series) reveal trends in climatological extremes for Europe that can directly be compared to the trends in other regions of the world; the indices are adequate for climate change detection as well as for impact assessment • Future plans ECA&D project: 2006 assessment report, improved daily dataset (coverage / elements / homogeneity / metadata / gridding / web-access), additional participants, communication of results both towards climate change detection and modelling community and towards applied climatology community