Extremes
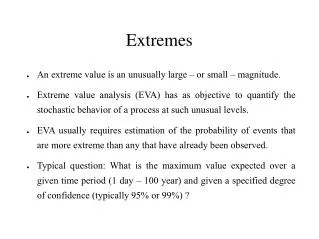
Extremes. An extreme value is an unusually large – or small – magnitude. Extreme value analysis (EVA) has as objective to quantify the stochastic behavior of a process at such unusual levels.

Extremes
E N D
Presentation Transcript
Extremes • An extreme value is an unusually large – or small – magnitude. • Extreme value analysis (EVA) has as objective to quantify the stochastic behavior of a process at such unusual levels. • EVA usually requires estimation of the probability of events that are more extreme than any that have already been observed. • Typical question: What is the maximum value expected over a given time period (1 day – 100 year) and given a specified degree of confidence (typically 95% or 99%) ?
. • source: ismev R-package; Coles2001 “An Introduction to Statistical Modeling of Extreme Values”
. • Before Extreme Value Theory two main approaches were used: • In economics and finance, value-at-risk (VaR), Gauss distribution; see for instance http://en.wikipedia.org/wiki/Value_at_risk • In hydrology, the Gumbel distribution; see for instance Chapter 18 of the Handbook of Hydrology, McGraw-Hill, Inv. 1992.
Katz, R.W., G.S. Brush, and M.B. Parlange, 2005: Statistics of extremes: Modeling ecological disturbances. Ecology, 86: 1124-1134
i.i.d and N-> ∞ • Xi is a sequence (i = 1, 2, · · · , N) or other collection of random variables independent and identically distributed (i.i.d.). The sequence is i.i.d. if each Xi has the same probability distribution as the others and all are mutually independent. If i.i.d. then it is stationary and independent. If i.i.d. then it is ergodic. • in short: Xi is a time series produced by some (random) device. • Reality: Not stationary, not independent, not ergodic, one sample, finite length.
. • . Gilleland, Eric and Katz, Richard W. "Analyzing seasonal to interannual extreme weather and climate variability with the extremes toolkit (extRemes)", Preprints: 18th Conference on Climate Variability and Change, 86th American Meteorological Society (AMS) Annual Meeting, 29 January - 2 February, 2006, Atlanta, Georgia. P2.15
Reproduced from: Stuart Coles; Journal of Hydrology, Volume 273, Number 1, 25 March 2003, pp. 35-50(16)
Usually replacing population parameter by approximations calculated using the observed sample. Data (measurement) errors and model errors (parametric or nonparametric, gaussian etc) are not included. Neither estimation error associated to the estimation method: Maximum Likelihood, Bayesian, Moments etc. Uncertainty is largely underestimated Picture from Wikipedia: http://en.wikipedia.org/wiki/Image:NYW-confidence-interval.png
Independence and classical EVA approachBlock maxima • In the classical extreme value analysis, data are blocked into sequences of observations of length R, generating a series of block maxima, m1, ..., mj. . Often the blocks correspond to a time period of length one year to which the GEV distribution can be fitted using some technique. Picture from: Eichner et.al. 2006 "Extreme value statistics in records with long-term persistence". Physical Review E 73.
Threshold ModelsGeneralized Pareto Distribution (GPD) Exceedances over thresholds (X-U). In this context there is an analog of the generalized extreme value distribution: the generalized Pareto distribution. The basic idea is to pick a high threshold U and study all the exceedances of U. The amount by which the threshold is exceeded follows a generalized Pareto Distribution (GPD):
Threshold selection • Several procedures for threshold selection are given in the literature. One method is based on the expected value for the excess of a threshold. It can be shown that: E(X-u | X>u) is a linear function of u. • “Is tempting to conclude that there is no stability until u=60, after which there is approximate linearity” • From: Coles 2001 “An Introduction to Statistical Modeling of Extreme values”
Poisson-GDP-Peaks over Threshold model From: Coles 2001: An Introduction to Statistical Modeling of Extreme Values. […] there are physical phenomena for which the Poisson process is a poor model: processes where there is a natural spacing, such as the location of trees in a forest; or processes that have natural clustering, such as the occurrence times of rainstorms.
From: K. Engeland et al. 2005, Extrems (7) 5-30: Pratical Extreme Value Modeling of Hydrological Floods and Droughts
r largest Order Statistics Point Process Approach Log-Pearson Type 3 […] Why are there so many models for extremes? As the real nature of natural data is unknown, and because there is always some differences between model’ s results and data, we can always suspect the basic hypothesis of a specific model and try to find another that supposedly fits better to the data. It is with no surprise that a variety of models exists, each model having its own set of assumptions. Other methods
from ”Nonstationarity versus scaling in hydrology” (Koutsoyiannis, 2005)
Our strategy It is to show overconfidence that to presume the present trend will continue and that it is impossible other natural or man-caused modifications will not induce trend variability. Even Newton’s Physics proved wrong. • Time Evolution of Extreme values : • Scenarios • Numerical simulations • Translate results (which?) from the numerical world to the real one. From: Alexander, L. V., et al. (2006), Global observed changes in daily climate extremes of temperature and precipitation, J. Geophys. Res., 111, D05109.