Download
1 / 1
10 likes | 130 Views
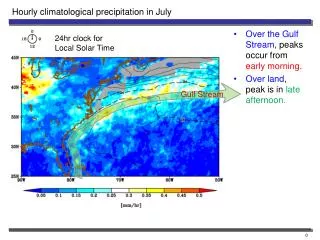
This project explores the robustness and density of the Oklahoma Climate Observing Network over time through innovative metadata graphics. The graphics provide insight into how coverage has evolved from 1895 to the present, showcasing the relationship between station locations and the areas they serve. By integrating metadata and visual tools, we aim to enhance clients' understanding of data integrity while illustrating the significant increase in both the number and spatial distribution of observation stations. This initiative emphasizes the importance of metadata in climate data access and usability.

E N D
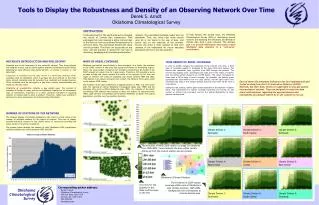
Tools to Display the Robustness and Density of an Observing Network Over Time Derek S. Arndt Oklahoma Climatological Survey TIME-SERIES OF AREAL COVERAGE In order to further compare the robustness of the network over time, a third type of metadata graphic is displayed to the data client (see below). The bottom axis represents time, typically from 1895 through the present. The vertical axis displays area – specifically, the total area in the region of interest that lies within certain distances of a COOP station. The colors correspond to those used in OCS’s maps of areal coverage. For example, the darkest green represents the area within 6 km of a coop station, and the light cream color represents the area of the climate division that was more than 30 km from a coop station. During the last century, darker green areas expanded at the expense of lighter areas. This improvement in station coverage represents two trends: (1) the number of stations has increased, and (2) the spatial distribution of those stations has improved. METADATA INTRODUCTION AND PHILOSOPHY Metadata are a vital component of any network’s dataset. They bring richness and integrity to data, just as careful quality assurance techniques ensure fidelity. Metadata are most effective when delivered with – or, ideally, in advance of – the data itself. Integration of metadata into the data stream is a three-step challenge. First, metadata must be identified, which is perhaps the most difficult of the three steps. Second, metadata must be harvested in a consistent and prudent manner. Third, metadata must be conveyed in a way that is useful, understandable and timely for the data client. Simplicity of presentation remains a key design goal.The concept of metadata is foreign to many and can be mistakenly regarded as an unnecessary layer of information, especially to a client primarily interested in acquiring weather or climate data to solve a problem. Therefore, tables were avoided in deference to more visual means of communicating information. MAPS OF AREAL COVERAGE Oklahoma was settled intermittently in time and space. As a result, the evolution of the COOP network in the state was spotty and limited to developing regions. Often, the total number of stations isn't enough to demonstrate the health of the COOP network at a given time for a given place. Therefore, OCS provides a series of maps to help the client evaluate the health of the network for his time and region of interest. The maps are available each month between 1889 and 2002. They display, in an easy-to-interpret color format, the distance from a given point to the nearest COOP station. The evolution of the state's settlement is apparent below. In 1896, just a few years after the opening of central Oklahoma’s Unassigned Lands (Apr. 1889) and the Cherokee Strip across northern Oklahoma (Sep. 1893), the majority of the state's functioning COOP stations were located in these two regions. At statehood (Nov. 1907), large portions of southeast and northwest Oklahoma contained very sparse populations, and thus very few weather observers. Oklahoma Climatological Survey Each of these OCS metadata indicators was first implemented and tested on data from the U.S Cooperative Observer (COOP) Network, but their basic tenets are applicable to any geo-spatial meteorological dataset. They are designed to assist the data client with decisions regarding the appropriateness and availability of a dataset before he or she commits to its use. NUMBER OF STATIONS IN THE NETWORK The simplest display of metadata available to the client is a time series of the number of available stations for the region of interest. This type of display provides historical context for the client's period of interest by providing the entire period of record for comparison. The graphic below displays the number of valid Oklahoma COOP precipitation stations available each month between 1895 and 2002. The evolution of NWS COOP station coverage for Oklahoma from 1895-2002. Colors indicate the area within certain distances from the nearest station (see key below). Oklahoma’s Climate Divisions The evolution of COOP station coverage within each of Oklahoma’s nine climate divisions, 1895-2002. Background color corresponds to climate division map. Color key for the graphics in this table and the maps to the left. • Corresponding author address: • Derek S. Arndt • Oklahoma Climatological Survey • 100 East Boyd, Suite 1210 • Norman, OK 73019-1012 • 405-325-2541 • darndt@ou.edu Oklahoma Climatological Survey