Download
1 / 55
550 likes | 674 Views
Administrative Tools. Comparison of Grade Level Graphs for Ethnicity, Home Language, Parent Education, Gender, Language Fluency Description of test by standards, graphs by tasks. Shape of the Data. Shape of the Data. Shape of the Data. Shape of the Data. Shape of the Data.

E N D
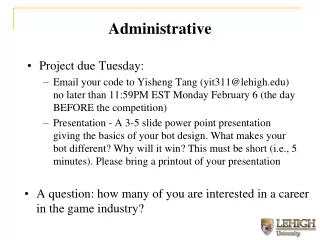
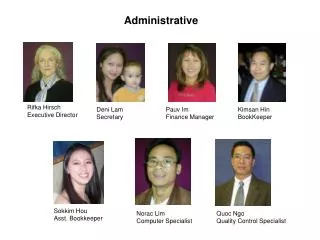
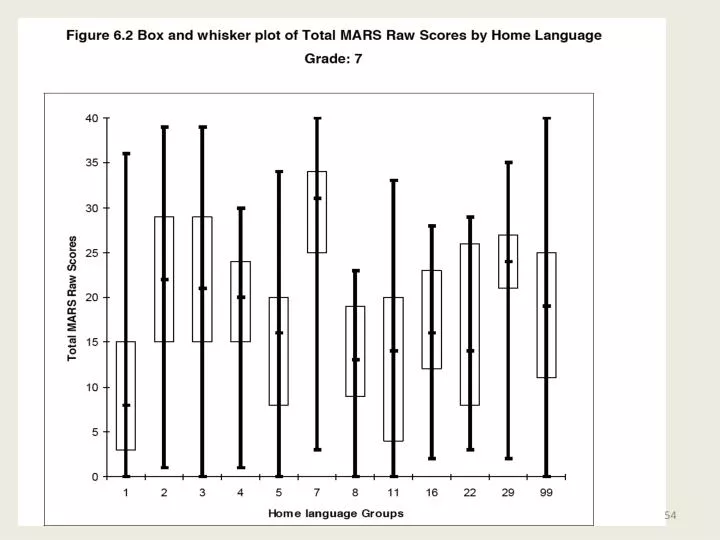
Administrative Tools • Comparison of Grade Level • Graphs for Ethnicity, Home Language, Parent Education, Gender, Language Fluency • Description of test by standards, graphs by tasks
Appendices • NSLP Performance Levels • Comparison of CST Levels to MARS Levels • Correlations of STAR Scores to MARS Scores • Correlations of CST Clusters to MAC Tasks • Status of the Data • Comparison of Raw Scores by District • Audit Report by task and District
Trends in Data Using Formative Assessment
Embedded formative assessment So the model that says learn while you’re in school, while you’re young, the skills that you will apply during your lifetime is no longer tenable. The skills that you can learn when your at school will not be applicable. They will be obsolete by the time you get into the workplace and need them, except one skill.
Embedded formative assessment The one really competitive skill is the skill of being able to learn. It is the skill being able not to give the right answer to questions about which you were taught at school, but to make the right response to situations that are outside the scope of what you were taught in school. We need to produce people who know how to act when they’re faced with situations for which they were not specifically prepared. Seymour Papert (1998)
Teacher Effect It doesn’t matter very much which school you go to , but it matters very much which classrooms you’re in. In the US, the classroom effect appears o be at least four times the size of the school effect (PISA, 2007) The greatest impact on learning is the daily lived experiences of students in classrooms, and that is determined much more by how teachers teach.
Variety of styles/strategies “teachers should not try to fit their teaching to each child’s style, but rather that they should become aware of different styles and help students also become aware of different styles and then encourage all students to use as wide a variety of styles as possible.
Use of Formative Assessment Research suggested that attention to the use of assessment to inform instruction particularly at the classroom level in many cases effective doubled the speed of student learning.
Five elements of using assessment to inform learning • The provision of effective feedback to students • The active involvement of students in their own learning • The adjustment of teaching to into account the results of assessment
Five elements of using assessment to inform learning • The recognition of the profound influence assessment has on the motivation and self-esteem of students, both of which are crucial influences on learning • The need for students to be able to assess themselves and understand how to improve
The teacher’s job is not to transmit knowledge. It is to engineer effective learning environments for students. The features of effective environments are that they create student engagement and Allow teachers, learners, and their peers to ensure that learning is Proceeding in the intended directions.
An important technique for helping students understanding learning intentions and success criteria is asking them to look at samples of other students’ work and to engage in a discussion about the strengths and weaknesses of each. Students are much better at spotting errors and weaknesses in the work of others than they are in their own.
Questions that give us insight into student learning are not easy to generate and often do not look like traditional test questions. In the U.S. most teachers spend a majority of their lesson preparation time grading student work, and almost invariably doing so alone. In other countries much, if not the majority of lesson preparation time is spent planning how new topics can be introduced and which contexts and examples will be used, and teachers work in groups to devise questions to find out whether their teaching has been successful.
Only 8% of the questions asked by teachers required the students to analyze, to make inferences, or to generalize. Less than 10% of the questions that were asked by teachers actually caused any new learning. Only two good reasons to ask questions in class: to cause thinking and o provide information for the teacher about what to do next.
How to provide constructive written feedback on the mathematics homework produced by their students - feedback included specific comments on errors, suggestions to students about how to improve and at least one positive remark. Students receiving constructive feedback learned twice as fast as control-group. Students given only comments scored on average 30% higher on work done in the next lesson than that done in the first.
Students working logo enabled them to get a solution with little mental effort. For those using pencil and paper, working out the effect of a single rotation was much more time consuming, giving students an incentive to think carefully, and this greater “mindfulness” led to more learning. Students given the scaffolded response learned more and retained their learning longer than those given full solutions.
Putting Principals into Practice Mathematical Practices • Attend to precision. -use clear definitions • Construct viable arguments and critique the reasoning of others. Briefly: Think of a definition for perimeter. Share with a neighbor.
Marco thinks Plan C has a larger perimeter than Plans A and B. Explain why Marco is wrong.
Look at sample work and engage in discussion about strengths and weaknesses “Marco probably counted. But he counted wrong.” “How could this explanation be improved? What is missing to make it convincing?”
Getting students engaged “Plan A and B have bigger areas, so they have bigger perimeters.” Do you agree or disagree? Is this sometimes true, always true, or never true?
Understanding Learning Trajectory and a Variety of Strategies Jade sold only Peanut Butter Cookie Dough. She raised $32. How many Tubs did she sell?
What do you think the student is doing? What do the lines represent? What do the numbers represent? Does it make sense?
This helps lay the foundation for proportional reasoning at later grades, for understanding input/output tables, for making graphs.
Understanding Learning Trajectory Situating the mathematics of the task in the learning trajectory for number and data:At earlier grade levels students have been learning about data collection and representation in the form of bar graphs. At this grade level students are extending the ways of displaying data to include line plots. In second and third grade students have been successfully thinking about most and least and using comparison subtraction to find the how many more. Also at third grade students have started to expand their ideas about number to include fractions, as parts of a whole, and use rulers to measure with fractions.
Understanding Learning Trajectory At this grade level students are starting to decompose a fraction into a sum of its parts and add and subtract fractions. At later grades students will learn algorithms for adding and subtracting fractions. Students will perform more complex analysis of data to look at mean, median, mode and range.
Promote learning/ push thinking “As teachers we are not interested in our students’ ability to do what we have taught them to do. We are only interested in their ability to apply their newly acquired knowledge to a similar but different situation.”
Asking a Question that gives Insight into learning How much longer was the longest wingspan from theshortest?
Understanding Place Value and Subtraction What does a student need to understand to use this process? What principals remain in place from subtraction with whole numbers?
Understanding Place Value and Subtraction What principals about subtraction doesn’t the student understand?
Understanding Place Value and Subtraction What is going on in the diagram? Where do the numbers come from? Does this make sense?
Attention to the Use of Assessment Consider the following from 5th grade: She used 5/8 of the cooking oil. and
Extending Multiplicative Situations to Include Fraction Multipliers and Quantities NCTM 2002 Yearbook - Making Sense of Fractions, Ratios, and Proportions - gives tables on comparing whole-number multipliers and fractional multipliers. Teachers need to ensure that they provide a variety of problem types.
6th Grade - Rising to Meet CCSS • Only 38% of the students met standards • Task 1 - 38% scored 0 or 1 point (Rate Concentrate) pick the juiciest for 1 point • Task 2 - 18.5% scored 0 or 1 (Freezing in Fargo) could identify the lowest temperature • Task 3 - 44% scored 0 or 1 (Fraction Match) complete addition equation • Task 4 - 29% scored 0 or 1 (Lattice Fence) count the rhombi in a picture • Task 5 - 51% scored 0 or 1 (Unfolding a Box) draw the unfolded box
Preparing Students Who Think No test can capture what is important for future progress: A fourth grade teacher who spends a great deal of time developing skills of independent and collaborative learning, who ensures that her students at solving problems, may find that her student scores on math are not as high as those who have emphasized only what is on the test. And yet, the teacher who inherits this class will look very good because of the firm foundations that were laid in place.
Quantitative Reasoning Which is the fruitier concentration?
What do you think this student is doing? What label could we attach to the division problem? How does this help us think about relationships?