Download
1 / 28
280 likes | 303 Views
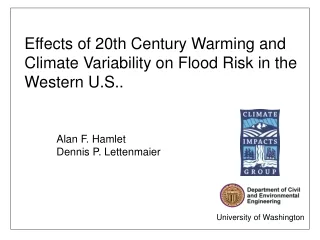
Hydrologic implications of 20th century warming in the western U.S. Alan Hamlet, Philip Mote, and Dennis Lettenmaier University of Washington. Snake River at Ice Harbor. Three changes. Western snowfed streamflow has been arriving earlier in the year in recent decades. Spring-pulse dates.

E N D
Hydrologic implications of 20th century warming in the western U.S. • Alan Hamlet, Philip Mote, and Dennis Lettenmaier • University of Washington
Snake River at Ice Harbor Three changes
Western snowfed streamflow has been arriving earlier in the year in recent decades Spring-pulse dates Figure by Iris Stewart, Scripps Inst. of Oceanog. (UC San Diego) Center time Spring pulse Centers of Mass Stewart et al., 2005
As the West warms, winter flows rise and summer flows drop Figure by Iris Stewart, Scripps Inst. of Oceanog. (UC San Diego)
At almost every USHCN station, winters warmed + signs: warming but not statistically significant
Three Integrations 1916-2003 • Observed T and P • Observed T, P with interannual variability removed (“fixed P”) • Observed P, fixed T
Regionally averaged cool season temperature: standardized anomalies (1961-90 mean) Tmin 1920 1940 1960 1980 2000
Regionally averaged Oct-Mar precipitation: standardized anomalies 1920 1940 1960 1980 2000
Regionally averaged Apr-Sep precipitation: standardized anomalies 1920 1940 1960 1980 2000
Trend in SFE/P, 1949-2004 figure courtesy Noah Knowles, UCSD Knowles et al. 2006
1950-1997 relative trends in April 1 SWE vs DJF temperature Obs VIC
April 1 SWE trends, 1950-2002 aT<T> aP<P>
Trends in April 1 SWE for the WA and OR Cascades 1950-2003 -35% Effects of Temperature And Precipitation 1960 1980 2000 -23% Effects of Temperature Alone 1960 1980 2000
Trends in April 1 SWE for the WA and OR Cascades 1916-2003 -19% Effects of Temperature And Precipitation 1960 1920 1940 1980 2000 -25% Effects of Temperature Alone 1960 1920 1940 1980 2000
As the West warms, winter flows rise and summer flows drop Figure by Iris Stewart, Scripps Inst. of Oceanog. (UC San Diego)
Trends in simulated fraction of annual runoff in each month from 1947-2003 (cells > 50 mm of SWE on April 1) June March Relative Trend (% per year)
Trends in March Runoff DJF Temp (°C) T and p fixed p Trend %/yr
Simulated Changes in the 20-year Flood Associated with 20th Century Warming Color: month of usual flood red=Jan, purple=Feb, lt green=Mar, dark green=Apr, blue=May, black=Jun DJF Avg Temp (C) 2003 Flood/1915 Flood 2003 Flood/1915 Flood
Conclusions • Observations, empirical analysis, and VIC simulations show consistent hydrologic responses to western warming in sensitive basins: • reductions in snowpack • shifts in flow from summer to winter • changed flood risk