Download
1 / 62
620 likes | 747 Views
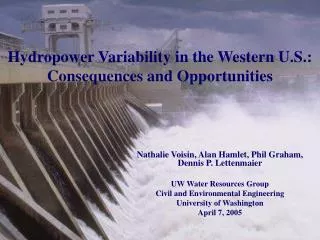
Hydrologic Implications of 20th Century Warming and Climate Variability in the Western U.S. Alan F. Hamlet Prof. Dennis P. Lettenmaier (Chair) Phd Final Exam May, 2006. Acknowledgements:. Western Water Assessment: Martyn Clark. Committee: Dennis P. Lettenmaier (chair)

E N D
Hydrologic Implications of 20th Century Warming and Climate Variability in the Western U.S. Alan F. Hamlet Prof. Dennis P. Lettenmaier (Chair) Phd Final Exam May, 2006
Acknowledgements: Western Water Assessment: Martyn Clark Committee: Dennis P. Lettenmaier (chair) Deirdre Meldrum (GSR) Stephen Burges Daniel Cayan Richard Palmer Nathan Mantua CIG: Philip Mote Edward Miles Adrienne Karpov Hydro Group: Andy Wood Ted Bohn Kostas Andreadis Jenny Adam Family and Friends: Carys Kresny Rhys Hamlet Anya Kresny Bill Kennedy
Background and Introduction
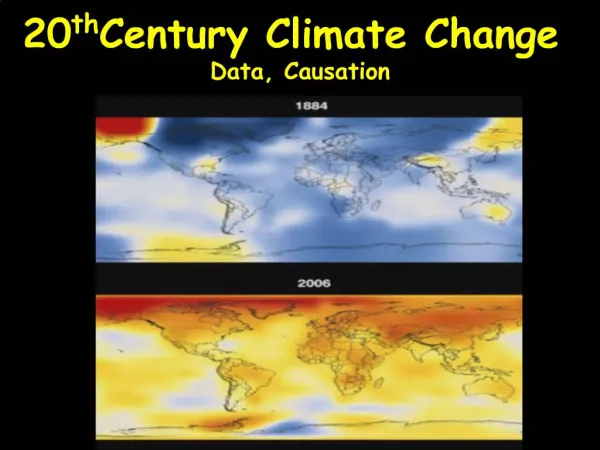
Natural AND human influences explain the observations of global warming best. Natural Climate Influence Human Climate Influence All Climate Influences
Pacific Decadal Oscillation El Niño Southern Oscillation A history of the PDO A history of ENSO warm warm cool 1900 1910 1920 1930 1940 1950 1960 1970 1980 1990 2000 1900 1910 1920 1930 1940 1950 1960 1970 1980 1990 2000
Cool Season Climate of the Western U.S. PNW GB CA CRB DJF Temp (°C) NDJFM Precip (mm)
Seasonal Water Balance Naches River 20th Century Climate More runoff in winter and early spring, less in summer 2040s Scenario (+ 2.25 C + 4% Pcp)
At almost every USHCN station, winters warmed + signs: warming but not statistically significant
Climate change experiments have suggested that in temperature sensitive areas of the West, we should already be able to see the effects of global warming in the historic snow and streamflow records. Using models we should be able to more fully analyze these changes, as well as other hydrologic effects which are not typically measured.
Why Do We Need Model Simulations of the Historic Record? • Longer Record (Avoids problems with decadal variability from 1950 forwards) • Spatial Coverage (high and low elevations not in the observations), river basin scale impacts. • Temporal Resolution (daily time step) • Full suite of hydrologic variables and consistency amongst these variables • Explicit sensitivity analysis for effects of temperature and precipitation
Cool Season Precipitation Anomalies Compared to the PDO -0.845 -0.264 -0.438 -0.053 (Regional to PDO Correlation R2 ) PNW Trend CRB Trend
PNW GB CA CRB Schematic of VIC Hydrologic Model and Energy Balance Snow Model Snow Model
Overview of Research Questions: • How have variations in temperature and precipitation from the early 20th Century on (1916-2003) affected trends in hydrologic variables such as snowpack, volume and timing of runoff and baseflow, seasonal evaporation and soil moisture, and flood risk in the western U.S.? • Is a consistent global warming signal apparent over the western U.S. in this period, and is it possible to make a clear distinction between “natural” variations such as decadal precipitation variability and more systematic effects associated with global warming signals? Are temperature and precipitation different in this regard? • What role do regional climatic regimes and topographic variations play in defining the role of temperature and precipitation variability on hydrologic variations? What areas of the western U.S. are most sensitive to changes in temperature or precipitation changes and why?
Research Questions (cont.): • Do the hydroclimatic variations observed in the western U.S. over the 20th century corroborate simulations of climatic changes produced by global climate model scenarios? For instance, is a hypothesis of wetter conditions in the western U.S. due to an intensified global hydrologic cycle born out in the observations? If so, how have these changes affected hydrologic variability? • How do flood risks vary in time and how can these risks be characterized and predicted in the context of interannual and interdecadal climate variability and longer-term variations associated with global warming?
Research Topics • Methods for producing long meteorological driving data sets • Effects of observed climate variability on snowpack trends • Effects of observed climate variability on trends in runoff, soil moisture, and evaporation • Evaluating changing flood risks in the context of climate variability and global warming
Problems with Temporal Inconsistencies in Meteorological Records (S. F. Flathead River at Hungry Horse Dam, MT)
Result: Daily Precipitation, Tmax, Tmin 1915-2003
Comparison of adjusted vs. unadjusted VIC simulations (S. F. Flathead River at Hungry Horse Dam, MT) Simulated vs Observed Root square error
Evaluation of Streamflow Simulations of the Colorado River at Lee’s Ferry, AZ
Regionally Averaged Cool Season Temperature Anomalies 0.74 0.63 0.76 0.62 (Regional to Global Correlation R2 ) TMAX
Regionally Averaged Cool Season Temperature Anomalies 0.84 0.87 0.94 0.73 (Regional to Global Correlation R2 ) TMIN
Regionally Averaged Cool Season Precipitation Anomalies PRECIP
Trends in Cool Season (Oct-Mar) Precipitation and Temperature Tmax Tmin Precipitation 1916- 2003 DJF Avg Temperature Trend (°C/yr) Trend (°C/yr) Rel. Trend %/yr 1947- 2003 DJF Avg Temperature Trend (°C/yr) Trend (°C/yr) Rel. Trend %/yr
Trends in Warm Season (Apr-Sept) Precipitation and Temperature Tmax Tmin Precipitation DJF Avg Temperature 1916- 2003 Trend (°C/yr) Trend (°C/yr) Rel. Trend %/yr DJF Avg Temperature 1947- 2003 Trend (°C/yr) Trend (°C/yr) Rel. Trend %/yr
2) Effects of Temperature and Precipitation Variability on Snowpack Trends in the Western U.S.
Overview of Simulation and Analysis Met Data 1915-2003 Linear Trend Analysis VIC SWE • 1916-2003 • 1924-1976 (warm to cool PDO) • 1947-1997 (cool to warm PDO) • 1924-1946 with 1977-1997 (warm to warm PDO) Linear Trends: • Base—combined effects of temp and precip trends • Static Precip—effects of temperature trends only • Static Temp—effects of precipitation trends only Experiments:
Trends in April 1 SWE 1950-1997 Mote P.W.,Hamlet A.F., Clark M.P., Lettenmaier D.P., 2005, Declining mountain snowpack in western North America, BAMS, 86 (1): 39-49
1950-1997 relative trends in April 1 SWE vs DJF temperature Obs VIC Obs VIC Obs VIC Obs VIC
Overall Trends in April 1 SWE from 1947-2003 DJF avg T (C) Trend %/yr Trend %/yr
Temperature Related Trends in April 1 SWE from 1947-2003 DJF avg T (C) Trend %/yr Trend %/yr
Precipitation Related Trends in April 1 SWE from 1947-2003 DJF avg T (C) Trend %/yr Trend %/yr
1916-2003 DJF avg T (C) Decadal Variability Doesn’t Explain the Temperature Related Effects to Snowpack Trend %/yr 1947-2003 DJF avg T (C) 1925-1946 with 1977-2003 DJF avg T (C) Trend %/yr
Trends in the Date of Snow Accumulation and Melt a) 10 % Accum. b) Max Accum. c) 90 % Melt 1916-2003 Change in Date Change in Date Change in Date DJF Temp (C) DJF Temp (C) DJF Temp (C) Change in Date Change in Date Change in Date
1916-2003 a) 10 % Accum. b) Max Accum. c) 90 % Melt Effects of Temperature and Precipitation DJF Temp (C) DJF Temp (C) DJF Temp (C) Change in Date Change in Date Change in Date Effects of Temperature only DJF Temp (C) DJF Temp (C) DJF Temp (C) Change in Date Change in Date Change in Date Effects of Precipitation only DJF Temp (C) DJF Temp (C) DJF Temp (C) Change in Date Change in Date Change in Date
3) Trends in Seasonal Runoff, Evaporation, and Soil Moisture
As the West warms, winter flows rise and summer flows drop Stewart IT, Cayan DR, Dettinger MD, 2005, Changes toward earlier streamflow timing across western North America, J. Climate, 18 (8): 1136-1155
Trends in simulated fraction of annual runoff in each month from 1947-2003 (cells > 50 mm of SWE on April 1) June March Relative Trend (% per year)
Trends in March Runoff Trends in June Runoff DJF Temp (°C) DJF Temp (°C) Trend %/yr Trend %/yr
Trends in Simulated Soil Moisture from 1947-2003 DJF Temp (°C) April 1 Trend %/yr July 1 DJF Temp (°C) Trend %/yr
Trends in April 1 SM Trends in July 1 SM DJF Temp (°C) DJF Temp (°C) Trend %/yr Trend %/yr
Trends in the Dates of 50% WY runoff, 80% max soil moisture recharge, and 50% WY ET
50% WY Runoff 80% Max SM 50% WY ET Cumulative Trends in the Date of Hydrologic Events (1947-2003) BR BR BR DJF Temp (°C) FPR FPR FPR Effects of Temp alone DJF Temp (°C) FTR FTR FTR Effects of Precip alone DJF Temp (°C) Trend days/50 yr
Trends in the “Runoff Ratio” (runoff/precipitation)
Effects of Cool Season Precipitation Trends on Trends in the Runoff Ratio Trend Runoff Ratio Trend Oct-Mar PCP
Temperature Related Downward Trends in Annual Streamflow at The Dalles Compared with the Effects of Precipitation Variability Black trace = constant precip Magenta trace = with precip variability
Evaluating the Hydrologic Model Simulations in the Context of Reproducing Flood Characteristics Ln (X100 / Xmean) OBS Avg WY Date of Flooding OBS Avg WY Date of Flooding VIC Ln (X100 / Xmean) VIC