
Download

1 / 17
Download Presentation 
Bar Graph bar chart
An Image/Link below is provided (as is) to download presentation
Download Policy: Content on the Website is provided to you AS IS for your information and personal use and may not be sold / licensed / shared on other websites without getting consent from its author.
Content is provided to you AS IS for your information and personal use only.
Download presentation by click this link.
While downloading, if for some reason you are not able to download a presentation, the publisher may have deleted the file from their server.
During download, if you can't get a presentation, the file might be deleted by the publisher.
E N D
Presentation Transcript
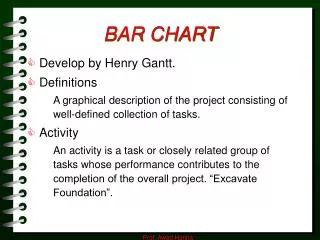
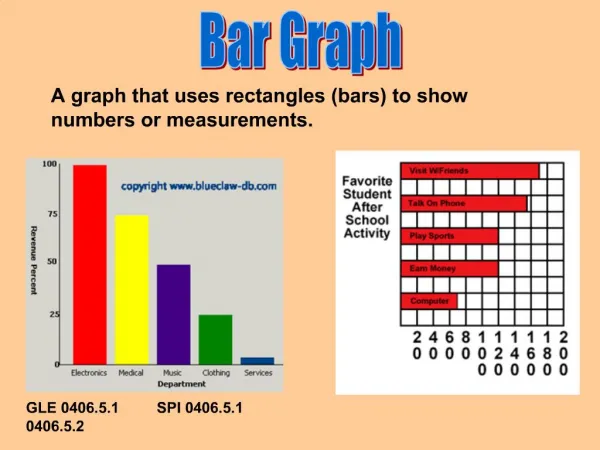
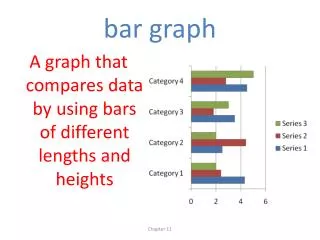
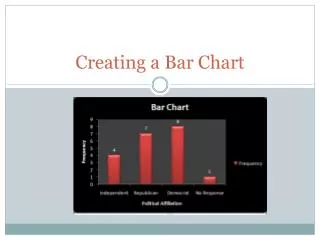
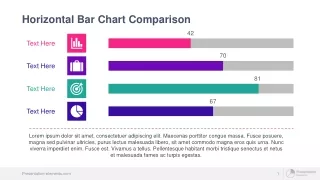
1. Bar Graph (bar chart) A graphical representation of a table of data in which the height or length of each bar indicates its frequency. The bars are separated from each other to highlight that the data are discrete or �counted� data. In a vertical bar graph, the horizontal axis shows the values or categories, and the vertical axis shows the frequency or tally for each of the values or categories on the horizontal axis. In a horizontal bar graph, the vertical axis shows the values or categories, and the horizontal axis shows the frequencies.


More Related