Background
10 likes | 196 Views
Evidence for abiotic DOC losses in a peatland stream Sheila M. Palmer, Mark Crowther and Pippa Chapman School of Geography, University of Leeds, Leeds, LS2 9JT, UK. s.m.palmer@leeds.ac.uk. Background

Background
E N D
Presentation Transcript
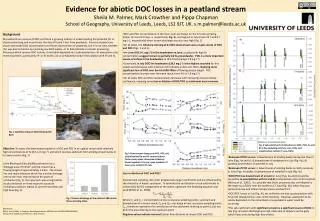
Evidence for abiotic DOC losses in a peatland streamSheila M. Palmer, Mark Crowther and Pippa ChapmanSchool of Geography, University of Leeds, Leeds, LS2 9JT, UK. s.m.palmer@leeds.ac.uk Background All peatlands are sources of DOC and there is growing interest in understanding the potential for in-stream processing and in particular the fate of fluvial C lost from peatlands. Previous studies have shown decreased DOC concentrations and fluxes downstream of peatlands, but it is not clear whether this was due to dilution by incoming low-DOC waters, or to biotic/abiotic in-stream processing. Processes which remove DOC include: i) microbial degradation; ii) photoreduction; iii) adsorption onto mineral particles, particularly Fe- or Al-oxides; iv) co-precipitation and/or flocculation with Fe and Al. Objective: To assess the downstream patterns in DOC and POC in an upland stream with relatively high concentrations of Fe (0.5-1.0 mg L-1) and which receives sediment from eroding stream banks in its lower section (Fig. 1). • DOC and POC concentrations in the main stem are lowest on the 17 June sampling (mean 12.3 and 2.8 mg L-1, respectively; Fig. 3), and highest in July (mean 25.7 and 3.7 mg L-1, respectively) when stream discharge was also very high (Fig. 2). • On all dates, the tributary entering at 0.74km downstream was a major source of DOC and POC (Figs. 1 and 3). • Very low DOC (<1 mg L-1) in the headwaters in June, coupled with high Fe concentrations suggest stream is partially fed by groundwater. POC is a more important source of carbon in the headwaters at this time (average 2.8 mg L-1). • Conversely, in July DOC the headwaters (38.5 mg L-1) is the highest recorded for this stream and decreases with distance until tributary enters at 0.74km, implying some significant loss of DOC over the first 600-700m of flowing stream length. POC concentrations increase over the same reach, from 4.6 to 5.8 mg L-1). • On all dates DOC and POC concentrations decrease with increasing distance below confluence, implying some loss or dilution of DOC/POC as catchment area increases. a) b) c) Fig. 1 Catchment map of Little Blowing Gill Beck Fig. 4 Sub-catchment contributions to DOC, POC, Fe and Al at key sampling points (y-axis, LHS), and metal/carbon rations (Y-axis, RHS). Fig.3 Downstream changes in DOC, POC, pH, total dissolved Fe and Al concentrations. Circles=main stem; diamonds=tributary. Closed symbols=11 June; open symbols=17 June; grey symbols=15 July. • Removal of DOC occurs: i) downstream of eroding banks during low flow in June (Figs. 4a and b); ii) downstream of headwaters in July (Fig. 4c); iii) possibly downstream of waterfall in July. • Removal of POC occurs: i) downstream of eroding banks on both occasions in June (Figs. 4a andb); ii) downstream of waterfall in July (Fig. 4c). • DOC/POC loss downstream of erosion in June (Figs. 4a and b) could be caused by co-precipitation with Fe and Al (metal/carbon ratio >0.03 mol/mol (Nierop et al., 2002). It is possible that biotic processes also contributed to the large loss of DOC near the outlet on 17 June (Fig. 4b), when flow was particularly low and stream temperatures reached 21oC. • DOC/POC losses in July (Fig. 4c) are unlikely to be due to precipitation with Fe and Al (metal/carbon ratio <0.03 mol/mol). However, adsorption to Fe-oxides deposited on the streambed or suspended in water could be occurring. • The sub-catchment with significant erosion is a significant source of DOC in July (Fig. 4c) when discharge was high, likely due to delivery via the gully which flows only during high flow events. Little Blowing Gill Beck (LBB) catchment has a drainage area of 0.8 km2 and the stream has a flowing length of approximately 1.8 km. The stream has one major tributary which has a similar drainage area to the main channel above the point of confluence (Fig. 1). Our approach was a longitudinal study conducted on three separate occasions including conditions typical of summer baseflow and high flow (Fig. 2). Loss or dilution of DOC and POC? Downstream sampling sites drain progressively larger catchments and are influenced by the chemistry of waters upstream. To estimate the contribution of sub-catchments to stream DOC & POC independent of the waters upstream, the following equation was used (Billett et al., 2006): Cd-u = QdCd – QuCu Qd – Qu Where Cu and Cd = concentration at two successive sampling points, upstream and downstream of a stream reach; Qu and Qd = discharge at two successive sampling points. Cd-u therefore represents the contribution of the catchment draining to point d, but not point the area draining to the upstream point. Negative values indicate removal (rather than dilution) of stream DOC and POC. Fig. 2 Stream discharge at the outlet of LBB on the three sampling dates References: Billett et al. (2006), J. Geophys. Res-Biogeosciences G02010, doi:10.1029/2005JG000065 Nierop et al. (2002), Sci.Tot.Environ. 300: 201-211.


