Download
1 / 52
520 likes | 719 Views
Organic Agriculture Worldwide: Key results from the survey on organic agriculture worldwide 2011 Part 1: Global data and survey background . Research Institute of Organic Agriculture FiBL, Frick, Switzerland, in cooperation with the

E N D
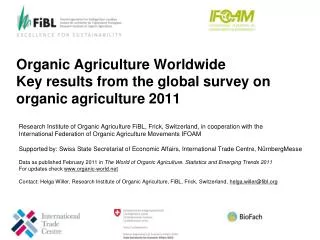
Organic Agriculture Worldwide: Key results from the survey on organic agriculture worldwide 2011Part 1: Global data and survey background Research Institute of Organic Agriculture FiBL, Frick, Switzerland, in cooperation with the International Federation of Organic Agriculture Movements IFOAM Supported by: Swiss State Secretariat of Economic Affairs, International Trade Centre, NürnbergMesse Data as published February 2011 in The World of Organic Agriculture. Statistics and Emerging Trends 2011 For updates check www.organic-world.net Contact: Helga Willer, Research Institute of Organic Agriculture, FiBL, Frick, Switzerland, helga.willer@fibl.orghttp://www.organic-world.net/presentations-2011.html
The Global Survey on Organic Agriculture: Supporters • International Trade Centre, Geneva • The Swiss State Secretariat of Economic Affairs SECO, Berne • Nürnberg Messe, the organizers of the BioFach Organic Trade Fair
The World of Organic Agriculture 2011 • The 12th editionof ‚The World ofOrganicAgriculture‘, was publishedby FiBL and IFOAM in February 2011.* • Contents: • Resultsofthesurvey on organicagricultureworldwide; • Organicagriculture in theregionsandcountryreports; • Armenia, Australia, Canada, Chile, China, Costa Rica, Indonesia, Kazakhstan, Republic of Korea, Pacific Islands, Switzerland, Tunisia, Uganda, United States and Ukraine. • Chapters on the global market, standards & legislations, voluntarystandardsandorganicbeekeeping • Numeroustablesandgraphs. • The bookcanbeordered via IFOAM.org and shop.FiBL.org. • *Willer, H, and Kilcher, L. (2011) The World ofOrganicAgriculture. Statisticsand Emerging Trends 2011. IFOAM, Bonn, and FiBL, Frick
Website www.organic-world.net • Detailed statistics in excel format (in progress) • Graphs & Maps • Data revisions • News and background information
Aboutthispresentation • Thereare 3 presentationssummarizingthekeyresultsofthe FiBL/IFOAM survey on organicagricultureworldwide 2011 (data 2009). In additionkeyresults on cropand on regional dataarepresented. • More informationisavailableatthepasswordareaof www.organic-world.net • The followingthreepresentationsareavailableat http://www.organic-world.net/presentations-2011.html: • Data backgroundandkeydata on organicagriculture: Land, producers, marketdata2009; Organicagriculture in developing countries 2009 • Land useandkeycrops in organicagriculture 2009 • Organicagriculture in theregions 2009
Data backgroundandkeydata on organicagriculture: Land, producers, marketdata2009
The 12th Survey on organic agriculture world-wide • The 12th survey on organic agriculture worldwide was carried out by the Research Institute of Organic Agriculture FiBL and the International Federation of Organic Agriculture Movements IFOAM. • The survey was carried out between July 2010 and February 2011. • Data were received from 160 countries (2008: 154 countries). • New countries included: Belarus, Channel Islands, Cook Islands, Grenada, Haiti, Myanmar. • Updated data on area and producers were available for 142 countries., • Data were provided by almost 200 country experts (representatives from NGOs, certification bodies, governments, researchers). • The following data were collected: • Area data (including land use and crop details); • Producers, other operator types; • Domestic market values; • Exports and imports. • The results are published in the yearbook ‘The World of Organic Agriculture 2011’ and at www.organic-world.net.
Countries and territories covered by the global survey on organic agriculture 2009 Source: FiBL & IFOAM Survey 2011
Organicdatacollectionsystemsworld-wide 2009 fordata on area, operatorsandproduction (total 160 countries) • Government collection systems (70 countries) • Data from the certifiers • Census/farm structure survey • Direct payments • Private collection systems (35 countries) • Data from the certifiers • Company data • No collection system (55 countries) • FiBL and IFOAM collect the data from the international certifiers Source: FiBL and IFOAM Survey 2011
International certifiers that provided data for several countries (2009 data)
General notes on the data • Data sources: For data sources see annex to The World of Organic Agriculture 2011. • Countries: For countries and areas, FiBL and IFOAM used the Standard Country and Area Codes Classifications as defined by the United Nations Statistics division. • Term organic: In the tables, the term organic refers to the fully converted and in-conversion areas. • Share of total agricultural land: In some cases the calculation of the shares of organic agricultural land, based on the Eurostat and FAOSTAT data, might differ from the organic shares obtained from ministries or local experts. • Producers: Some countries report the number of smallholders, and others only the numbers of companies, projects or grower groups, which may each comprise a number of producers. • Data revisions: Should data revisions and correction become necessary these are communicated at the data revision pages of Organic-World.net. http://www.organic-world.net/revisions.html
Key data/indicators on organic agriculture world-wide 2009 • 160 countries have data on organic agriculture (up from 154). • 37.2 million hectares of agricultural land are organic (including conversion areas). • The organic agricultural land increased by 2 million hectares or six percent. • 7 countries have more than ten percent organic agricultural land, 17 countries have between 5 and 10 percent. • There are 41.9 million hectares of further, non agricultural areas (up from 31.1 million hectares) • 1.8 million producers were reported (up from 1.4 million)
Definition of organic areas • Agricultural land (37.2 million hectares in 2009) • Cropland • Arable land (cereals, vegetables etc.) • Permanent crops (fruit, grapes, olives …) • Cropland, no details (=arable land and permanent crops) • Permanent grassland • Other agricultural land • Non-agricultural areas (41.9 million hectares in 2009) • Wild collection/Bee keeping • Forest • Aquaculture • Grazing areas on non-agricultural land
Organic agricultural land by region 2009 • Currently 37.2 million hectares are under organic agricultural management (end of 2009 formostdata). • The region with the most organic agricultural land is • Oceania, with 12.15 million hectares, followed by • Europe with almost 9.3 million hectares, • Latin America (8.6 million hectares), • Asia (3.6 million hectares), • North America (2.7 million hectares), and • Africa (more than 1 millionhectares). • Oceania has almost one-third of the global organic agricultural land, but its relative importance is decreasing. Europe, a region that has had a very constant growth of organic land over the years, has one quarter of the world’s organic agricultural land. The share of Latin America is slightly lower than that of Europe (23 percent). • In addition to the agricultural land, there are 41.9 million hectares of non-agricultural areas, mainly wild-collection.
Organic agricultural land and other organic areas 2009 Source: FiBL & IFOAM Survey 2011
Distribution of organic agricultural land by region 2009 Source: FiBL & IFOAM Survey 2011
The countries with the most organic agricultural land 2009 • Australia is the country with the most organic agricultural land, 97 percent of which is extensive grazing area. • Argentina is second, followed by the United States in third place. • The ten countries with the most organically managed land have a combined total of 27.5 million hectares, constituting three quarters of the world’s organic agricultural land.
World: The ten countries with the most organic agricultural land 2009 Argentina, US and Uruguay: Only fully converted areas Source: FiBL/IFOAM Survey 2011, based on data from governments, the private organic sector and certifiers.
Share of organic land of total agricultural area 2009 • The share of the world’s organic agricultural of all agricultural land is 0.85 percent. • By region, the share is highest in Oceania (2.8 percent), followed by Europe with 1.9 percent and Latin America with 1.4 percent. In the 27 countries of the European Union, the share of organically managed land is more than 4.7 percent. In the other regions, the share of organically managed land is less than one percent. • Seven countries have more than 10 percent organic land and 17 countries have between 5 and 10 percent organic land. • However, 68 percent of the countries for which data are available have less than one percent organicagriculturalland. • The country with the highest share is the Falkland Islands (Malvinas), where several large sheep farms are working organically, followed by Liechtenstein (26.9 percent) and Austria (18.5 percent). • It is interesting to note that many island states have high shares.
The ten countries/areas with the highest shares of organic agricultural land 2009 Source: FiBL/IFOAM Survey 2011, based on data from governments, organic sector organisations and certifiers.
Distribution of organic shares of the total agricultural areas 2009 (total countries 160) Source: FiBL & IFOAM 2011
Shares ofsomekeycropsoftherespective total area (2009)(not for all countries withdata on organicfarminglandusedatawereavailable) Source: FiBL/IFOAM Survey 2011, based on data from governments, organic sector organisations and certifiers.
Growth oftheorganicagriculturalland 2009 • Compared with the revised data from 2008, the organic agricultural land increased by more than two million hectares, or by six percent in 2009. • Compared with 1999, when data on organic agriculture worldwide were available for the first time the organic agricultural land has more than trebled.
Growth of the organic agricultural land 2000-2009 by region Source: FiBL/IFOAM/SOEL Surveys 2000- 2011
World: Development of organic agricultural land 1999-2009 Source: FiBL, IFOAM and SOEL 2000-2011
World: Development oforganicagriculturalland by region 1999-2009 Source: FiBL, IFOAM and SOEL 2000-2011
World: Development of organic agricultural land 2007 to 2009 by geographical region Source: FiBL & IFOAM Surveys 2009-2011
The ten countries with the highest INCREASE of organic agricultural land 2008-2009 Source: FiBL/IFOAM Survey 2011, based on data from governments, the private organic sector and certifiers
Further organic areas • Apart from the organic agricultural land there are further organic areas, the largest part of these are wild collection areas and areas for beekeeping, • Further areas are aquaculture, forest and grazing areas on non-agricultural land. • It should be noted, that many countries do not report these areas, as they only communicate the agricultural land. • The total area for these areas was 41.9 million hectares, constituting an increase of 10 million hectares compared with 2008. • Large increases of wild collection and beekeeping areas occurred in Cameroon and Russia.
Wild collectionandbeekeepingareas • 45.5 million hectares of wild collection and bee-keeping areas were reported for 2009. • The wild collection / bee-keeping areas are more or less evenly distributed over four regions: Africa, Asia, Europe and Latin America, reflecting quite a different pattern than that for agricultural land. • The collection of wild harvested crops is defined in the IFOAM Basic Standards (IFOAM 2006), and wild collection activities are regulated in organic laws.
Development of organic agricultural land and other organic areas 1999 to 2009 Source: FiBL /IFOAM/SÖL 2000-2011
Distribution oforganic wild collectionareas by region 2009 Source: FiBL & IFOAM Survey 2011
Organic wild collection: The ten countries withthelargest wild collectionareas (includingbee-keeping) 2009 FiBL/IFOAM Survey 2011, based on data from governments, the private organic sector and certifiers
Organic producers 2009 • For the current survey, a total of 1.8 million organic producers was reported, • This is an increase of more than 0.4 million compared with 2008. • In India, the number of organic producers almost doubled in 2009. • According to the data obtained, more than three quarters of the producers are located in Asia, Africa and Latin America. • The country with the most producers is India, followed by Uganda and Mexico. • It should be noted that not all certifiers reported the number of producers; their number is probably higher than 1.8 million.
The ten countries with the largest numbers of organic producers 2009 Source: FiBL/IFOAM Survey 2011, based on data from governments, the organic sector and certifiers
Organic producers by geographical region 2009 (total: 1.8 million) Source: FiBL & IFOAM 2011
World: Development of organic producers 1999-2009 Source: FiBL, IFOAM & SOEL 1999-2011
The global market for organic food and beverages 2009 • In 2009, the global market for certified organic food and drink was estimated to be 54.9 billion US Dollars or approximately 40 billion Euros (average exchange rate 2009, Sahota (2011). • The volume of the turnover with organic products has more than trebled since 1999, when it was estimated to be 15 billion US Dollars. With the economic crisis growth slowed down in 2009 in many countries, or stagnated (Germany), but some countries showed healthy growth also in 2009, for instance France (+19 percent) or Norway (+10 percent). • More than ninety percent of the organic product revenues is made in the Northern hemisphere. Europe accounts for 48 percent of the global organic food sales; North America for 48.1 percent (data 2009) • Sahota 2011 • In 2009, the by far largest market was the United States with 17.8 billion Euros of organic food sales, followed by Germany with 5.8 billion and France with 3 billion Euros . • In 2009, the countries with the highest market shares for organic food were Denmark (7.2 percent), followed by Austria (6 percent) and Switzerland (5.2 percent). • These are also the countries that have the highest annual per capita consumption : Denmark (139 Euros), Switzerland (132 Euros). • Shares that are reached for some products and product groups are, however, considerably higher as is shown by data that some countries provide. In Switzerland 17 percent of the eggs sold in the general retail trade are organic, 13 percent of the bread and 11 percent of the vegetables. The most popular organic product groups are fresh fruit and vegetables, dairy products and bakery wares. • Compiled by FiBL 2011
Source: Organic Monitor, Sahota 2011 Distribution of organic food sales by region 2009
The countries with the largest domestic markets for organic food 2009 Source: FiBL, based on national sources
Source: Organic Monitor (Sahota 2011) Development of the global market for organic food and beverages
Sources: Hamm/Rippin 2009, AMI 2010, 2011 Growth ofsaleswithorganicfoodandbeverages in Germany 2000-2010
The countries with the highest shares of organic food sales 2009 Source: Compiled by FiBL in cooperationwith , AMI and ORC 2011, based on national sources
The countries withthehighest per capitaconsumption 2009 Source: Compiled by FiBL in cooperationwith , AMI and ORC 2011, based on national sources
Switzerland: Shares of the total market for selected organic product groups 2009 Source: Bio Suisse 2010
Switzerland and USA: Importance of selected product groups of the overall turnover with organic food 2009 Source: Bio Suisse 2010 and OTA 2010
Organic farming in developing & transition countries and emerging markets 2009 • About one third of the world’s organic agricultural land – 13.4 million hectares - is located in developing/transition countries and in emerging markets.* Most of this land is in Latin American countries, with Asia and Africa in second and third place. • 1.5 million producers are in these countries. • *Countries listed in the List of Recipients of Official Development Assistance (ODA) of the Development Assistance Committee (DAC) of the Organization for Economic Cooperation and Development (OECD). The list is available at www.oecd.org/dataoecd/23/34/37954893.pdf.
Developing/transition countries andemergingmarkets*: The ten countries withthelargestareasoforganicagriculturalland 2009 FiBL/IFOAM Survey 2011, based on data from governments, the private organic sector and certifiers*= countries on the DAC list, see http://www.oecd.org/document/45/0,3746,en_2649_34447_2093101_1_1_1_1,00.html