Download
1 / 10
100 likes | 198 Views
Explore the role of Integrated Ocean Observing System (IOOS) in fisheries science and management, focusing on models of fish distribution and abundance useful for future applications. Learn how environmental variables such as depth, profile curvature, and sediment grain size impact fish habitats, alongside IOOS benthic and CTD data. Discover statistical models of fish-habitat associations, with a case study on Longfin squid. Discuss the potential of IOOS-informed studies on fish movement, growth, and mortality rates, and their implications for fisheries management and spatial planning. Investigate ecosystem monitoring applications, including cold pool dynamics and climate change effects on fish recruitment in the Mid-Atlantic Bight region. Engage with relevant stakeholders through online surveys, presentations, and research interviews to address current research needs effectively.

E N D
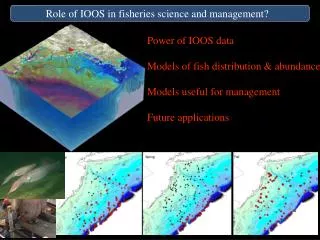
Role of IOOS in fisheries science and management? Power of IOOS data Models of fish distribution & abundance Models useful for management Future applications
What can we measure without going to sea that fish “care” about?
Multivariate Analysis Final Environmental Variables Used • Depth (log-transformed) • Profile curvature • Slope (residuals vs. depth) • Sediment grain size IOOS Benthic • SST • 488 nm reflectance • 551 nm reflectance (residuals vs. 488 nm) • Cross-shore velocity • Variance in cross-shore velocity • Divergence trend CTD • Mixed-layer depth • Simpson’s PE (limited to top 30 m) • Bottom temp • Bottom salinity (residuals vs. depth)
Community Axis 1 Temp Depth 551 nm resids
CTD CTD • Mixed-layer depth • Simpson’s PE (limited to top 30 m) • Bottom temp • Bottom salinity (residuals vs. depth) IOOS • SST • 488 nm reflectance • 551 nm reflectance (residuals vs. 488 nm) • Cross-shore velocity • Variance in cross-shore velocity • Divergence trend Statistical models of fish-habitat association Example: Longfin squid (live one year) Prey for fish, seabirds, sharks, seals,whales Predator of young stages of fish & crabs (eat ~500,000 tons of prey yr; ~33 x annual production of Fluke) • Depth (log-transformed) • Profile curvature • Slope (residuals vs. depth) • Sediment grain size Benthic Habitat data
Preliminary squid model (adjusted R2 = 0.85) IOOS Increased model power ~12-20% CPUE= bottom temperature + sediment grain size + current divergence+N488 radiance +(depth x SST) + (cross x along shelf current v)
HF radar divergence & upwelling-downwelling potential Upwelling Down welling Longfin squid HF radar Divergence potential Divergence downwelling upwelling Hypothesis: Upwelling & 1’+2’ production => high squid growth & size dependent survival? Test in IOOS informed studies of habitat on movement, growth, mortality & reproductive rates
Models useful for Fisheries Management, stock assessement, spatial planning? Two examples: • Need natural (& fishing) mortalities for stock assessments • Spiny dogfish may eat 25,000 to 120,000 tons of squid a year. (Fishery harvest in 2007: 12,300 tons) • IOOS informed models of dogfish, squid distributions & habitat specific encounter rates. Where/when is natural mortality likely to be high? • Bycatch of butterfish in squid fishery • Under what habitat conditions do squid & butterfish co-occur? • Use IOOS to tell squid fisherman where to fish avoid large butterfish bycatch.
Temperature Salinity Optical backscatter bb532 bb(532)/c(532) Ecosystem Monitoring: Cold pool dynamics, Climate change & Fish Recruitment Recruitment of some species in MABtied to Cold Pool Dynamics (e.g. yellowtail flounder, surf clams) Timing of Cold Pool turnover & bottom warming may affect survival of early stages of some MAB species. What are the mechanisms?
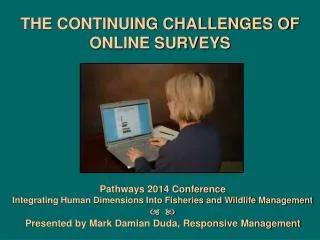
Relevance to Resource Management? Online survey (43 Atlantic coast scientists & managers) Presentation to MAFMC (June 2009) Coordination with SSC Interviews about current research needs