Download
1 / 49
490 likes | 507 Views
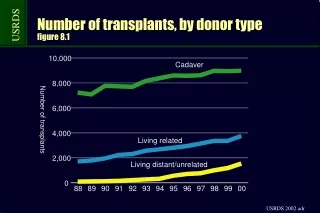
This figure shows the number of renal transplant operations in Australia and New Zealand from 1963 to 2001, including living donor and cadaver transplants. It also displays transplantation rates related to patients on dialysis and age groups.

E N D
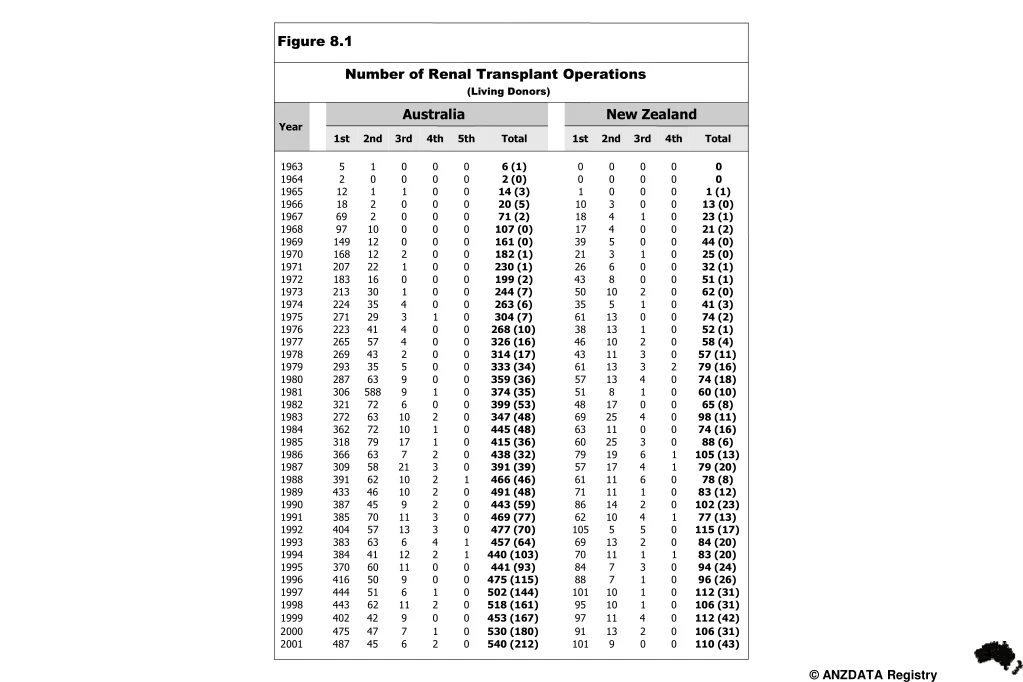
Figure 8.1 Number of Renal Transplant Operations (Living Donors) Australia New Zealand Year 1st 2nd 3rd 4th 5th Total 1st 2nd 3rd 4th Total 1963 5 1 0 0 0 6 (1) 0 0 0 0 0 1964 2 0 0 0 0 2 (0) 0 0 0 0 0 1965 12 1 1 0 0 14 (3) 1 0 0 0 1 (1) 1966 18 2 0 0 0 20 (5) 10 3 0 0 13 (0) 1967 69 2 0 0 0 71 (2) 18 4 1 0 23 (1) 1968 97 10 0 0 0 107 (0) 17 4 0 0 21 (2) 1969 149 12 0 0 0 161 (0) 39 5 0 0 44 (0) 1970 168 12 2 0 0 182 (1) 21 3 1 0 25 (0) 1971 207 22 1 0 0 230 (1) 26 6 0 0 32 (1) 1972 183 16 0 0 0 199 (2) 43 8 0 0 51 (1) 1973 213 30 1 0 0 244 (7) 50 10 2 0 62 (0) 1974 224 35 4 0 0 263 (6) 35 5 1 0 41 (3) 1975 271 29 3 1 0 304 (7) 61 13 0 0 74 (2) 1976 223 41 4 0 0 268 (10) 38 13 1 0 52 (1) 1977 265 57 4 0 0 326 (16) 46 10 2 0 58 (4) 1978 269 43 2 0 0 314 (17) 43 11 3 0 57 (11) 1979 293 35 5 0 0 333 (34) 61 13 3 2 79 (16) 1980 287 63 9 0 0 359 (36) 57 13 4 0 74 (18) 1981 306 588 9 1 0 374 (35) 51 8 1 0 60 (10) 1982 321 72 6 0 0 399 (53) 48 17 0 0 65 (8) 1983 272 63 10 2 0 347 (48) 69 25 4 0 98 (11) 1984 362 72 10 1 0 445 (48) 63 11 0 0 74 (16) 1985 318 79 17 1 0 415 (36) 60 25 3 0 88 (6) 1986 366 63 7 2 0 438 (32) 79 19 6 1 105 (13) 1987 309 58 21 3 0 391 (39) 57 17 4 1 79 (20) 1988 391 62 10 2 1 466 (46) 61 11 6 0 78 (8) 1989 433 46 10 2 0 491 (48) 71 11 1 0 83 (12) 1990 387 45 9 2 0 443 (59) 86 14 2 0 102 (23) 1991 385 70 11 3 0 469 (77) 62 10 4 1 77 (13) 1992 404 57 13 3 0 477 (70) 105 5 5 0 115 (17) 1993 383 63 6 4 1 457 (64) 69 13 2 0 84 (20) 1994 384 41 12 2 1 440 (103) 70 11 1 1 83 (20) 1995 370 60 11 0 0 441 (93) 84 7 3 0 94 (24) 1996 416 50 9 0 0 475 (115) 88 7 1 0 96 (26) 1997 444 51 6 1 0 502 (144) 101 10 1 0 112 (31) 1998 443 62 11 2 0 518 (161) 95 10 1 0 106 (31) 1999 402 42 9 0 0 453 (167) 97 11 4 0 112 (42) 2000 475 47 7 1 0 530 (180) 91 13 2 0 106 (31) 2001 487 45 6 2 0 540 (212) 101 9 0 0 110 (43)
Cadaver and Living Donor TransplantsAustralia 1995 - 2001 Number of Transplants
Cadaver and Living Donor TransplantsNew Zealand 1995 - 2001 Number of Transplants
Rate of Transplantation 2001 Related to Patients Dialysed All Patients
Rate of Transplantation 2001 Related to Patients Dialysed Patients - Age Group 15-59 Years
Rate of Transplantation 2001 Related to Patients Dialysed Australia 6.4%
Rate of Transplantation 2001 Related to Patients Dialysed New Zealand 6.0%
Figure 8.7 Graft Number and Age of Patients Transplanted 1-Jan-2001 to 31-Dec-2001 Age Groups Donor Graft Total Source No. 00-04 05-14 15-24 25-34 35-44 45-54 55-64 65-74 75-84 Australia 1 1 3 9 52 67 77 67 13 0 289 2 0 0 3 11 6 9 5 0 0 34 Cadaver 3 0 0 0 1 2 0 0 1 0 4 4 0 0 0 0 0 1 0 0 0 1 1 6 8 25 37 40 52 23 7 0 198 2 0 0 0 0 3 6 2 0 0 11 Living Donor 3 0 1 0 0 0 0 1 0 0 2 4 0 0 0 0 1 0 0 0 0 1 Total 7 12 37 101 119 145 98 21 0 540 New Zealand 1 1 0 5 7 13 18 13 5 0 62 Cadaver 2 0 0 0 1 2 2 0 0 0 5 1 0 2 6 10 8 9 4 0 0 39 Living Donor 2 0 0 2 0 2 0 0 0 0 4 Total 1 2 13 18 25 29 17 5 0 110
Transplant Operations (Per Million) 2001 Australia No. Tx 7 12 37 101 119 145 98 21
Transplant Operations (Per Million) 2001 New Zealand No. Tx 1 2 13 18 25 29 17 5
Figure 8.9 Australia Transplantation Rate - Age Group 15-59 years 1991 - 2001 Aboriginal and Caucasoid All Patients Torres St. Islanders Year Dialysed Tx Rate Dialysed Tx Rate Dialysed Tx Rate 1991 1963 363 18.4% 167 12 7.1% 2325 401 17.2% 1992 2005 350 17.4% 196 20 10.2% 2441 403 16.5% 1993 2075 328 15.8% 235 10 4.2% 2567 375 14.6% 1994 2224 334 15.0% 289 13 4.4% 2802 369 13.1% 1995 2320 317 13.6% 345 13 3.7% 2994 365 12.1% 1996 2448 358 14.6% 388 8 2.0% 3187 402 12.6% 1997 2526 358 14.1% 441 20 4.5% 3362 426 12.6% 1998 2653 357 13.4% 480 26 5.4% 3555 436 12.2% 1999 2743 322 11.7% 514 20 3.8% 3695 387 10.4% 2000 2864 386 13.4% 538 17 3.1% 3881 440 11.3% 2001 2932 391 13.3% 592 20 3.3% 4025 456 11.3%
Figure 8.10 New Zealand Transplantation Rate - Age Group 15-59 years 1991 - 2001 Caucasoid Maori Pacific Islander All Patients Year Dialysed Tx Rate Dialysed Tx Rate Dialysed Tx Rate Dialysed Tx Rate 1991 314 44 14.0% 188 15 7.9% 61 5 8.1% 579 67 11.5% 1992 336 80 23.8% 203 11 5.4% 64 3 4.7% 625 104 16.6% 1993 316 53 16.7% 211 4 1.8% 88 3 3.4% 639 63 9.8% 1994 317 52 16.4% 228 11 4.8% 96 5 5.2% 673 71 10.5% 1995 332 54 16.2% 240 11 4.5% 113 6 5.3% 725 78 10.7% 1996 349 58 16.6% 262 7 2.6% 129 7 5.4% 785 79 10.0% 1997 370 73 19.7% 279 9 3.2% 134 3 2.2% 827 91 11.0% 1998 372 60 16.1% 320 14 4.3% 151 7 4.6% 896 85 9.4% 1999 388 67 17.2% 317 16 5.0% 159 8 5.0% 928 98 10.5% 2000 400 68 17.0% 329 10 3.0% 183 4 2.1% 973 86 8.8% 2001 412 64 15.5% 355 13 3.6% 212 5 2.3% 1044 92 8.8%
Figure 8.11 New Transplanted Patients 1997 - 2001 Related to Race Race 1997 1998 1999 2000 2001 Australia (502) (518) (453) (530) (540) Caucasoid 425 (85%) 434 (84%) 379 (84%) 463 (88%) 469 (87%) Aboriginal/Torres St.Isl. 22 (4%) 28 (5%) 23 (5%) 18 (3%) 21 (4%) Asian 44 (9%) 37 (7%) 39 (9%) 38 (7%) 32 (6%) Other 13 (2%) 19 (4%) 12 (2%) 12 (2%) 20 (3%) New Zealand (112) (106) (112) (106) (110) Caucasoid 91 (81%) 77 (73%) 78 (70%) 81 (76%) 79 (72%) Maori 11 (10%) 17 (16%) 17 (15%) 13 (12%) 15 (14%) Pacific Islander 4 (4%) 7 (7%) 8 (7%) 4 (4%) 6 (5%) Asian 6 (5%) 4 (4%) 9 (8%) 8 (8%) 10 (9%) Other 0 1 (<1%) 0 0 0
Figure 8.12 Transplants in each Region 1997 - 2001 Number of Operations (per Million Population) State 1997 1998 1999 2000 2001 Queensland 98 (29) 93 (27) 64 (18) 105 (29) 121 (33) New South Wales/ACT 179 (27) 160 (24) 142 (21) 161 (24) 145 (21) H Victoria/Tasmania 128 (25) 131 (26) 126 (24) 136 (26) 155 (29) H South Australia/NT 64 (38) 84 (50) 70 (42) 68 (40) 69 (41) H Western Australia 33 (18) 50 (27) 51 (27) 60 (32) 50 (26) Australia 502 (27) 518 (28) 453 (24) 530 (28) 540 (28) For calculation of population related totals, H the populations of these States were amalgamated
AUST 24 26 27 28 24 28 28 NZ 26 26 30 28 29 28 29 Transplant Operations 1995 - 2001 Australian Transplant Regions Per Million Population
LD CAD Rate of Transplantation 2001Related to Population (Per Million) Residents of Australian States and New Zealand LD CAD * * Ops.123 124 18 148 11 58 10 49 541 109 *NSW population excludes residents of the Southern Area Health Service * ACT population includes residents of the Southern Area Health Service Medical services in the ACT service the Southern Area Region
Figure 8.15 Primary Cadaver Patient and Graft Survival 1991 - 2001 % Survival S.E. / Number at Risk ± n = Number of Patients Survival Year of Transplant 1 month 3 months 6 months 1 year 3 years 5 years Patient Survival 1991 n=313 99 ± 0.6 309 95 ± 1.2 298 95 ± 1.3 296 93 ± 1.4 292 89 ± 1.8 278 85 ± 2.0 267 1992 n=342 99 ± 0.5 339 97 ± 0.9 333 95 ± 1.1 326 93 ± 1.4 319 89 ± 1.7 305 83 ± 2.0 284 1993 n=323 98 ± 0.7 318 98 ± 0.9 315 96 ± 1.1 309 95 ± 1.2 307 92 ± 1.5 298 87 ± 1.9 280 1994 n=286 99 ± 0.6 283 98 ± 0.9 279 96 ± 1.1 275 96 ± 1.2 274 92 ± 1.6 262 84 ± 2.2 240 1995 n=290 100 ± 0.3 289 98 ± 0.8 285 96 ± 1.1 279 96 ± 1.2 278 92 ± 1.6 266 88 ± 1.9 254 1996 n=311 99 ± 0.6 307 96 ± 1.1 299 95 ± 1.2 296 95 ± 1.3 294 93 ± 1.5 289 88 ± 1.9 272 1997 n=313 98 ± 0.7 308 98 ± 0.8 306 97 ± 1.0 303 96 ± 1.1 300 89 ± 1.7 279 - 1998 n=293 99 ± 0.6 290 98 ± 0.9 286 97 ± 1.0 284 95 ± 1.3 278 93 ± 1.5 272 - 1999 n=248 99 ± 0.6 246 98 ± 0.9 243 96 ± 1.2 239 95 ± 1.4 235 - - 2000 n=311 100 ± 0.3 310 99 ± 0.4 309 98 ± 0.8 305 97 ± 1.0 301 - - 2001 n=289 99 ± 0.7 284 97 ± 1.0 279 97 ± 1.0 210 - - - Graft Survival 1991 n=313 91 ± 1.6 286 88 ± 1.9 275 86 ± 2.0 269 84 ± 2.1 262 76 ± 2.4 239 72 ± 2.6 224 1992 n=342 91 ± 1.5 312 90 ± 1.6 307 88 ± 1.8 300 86 ± 1.9 293 79 ± 2.2 269 72 ± 2.4 247 1993 n=323 92 ± 1.5 296 89 ± 1.7 288 87 ± 1.9 281 85 ± 2.0 276 81 ± 2.2 260 74 ± 2.4 237 1994 n=286 95 ± 1.3 271 94 ± 1.4 268 92 ± 1.6 262 91 ± 1.7 259 83 ± 2.2 236 72 ± 2.7 205 1995 n=290 96 ± 1.2 277 94 ± 1.4 272 91 ± 1.7 263 90 ± 1.8 260 83 ± 2.2 242 77 ± 2.5 222 1996 n=311 94 ± 1.4 291 91 ± 1.6 284 90 ± 1.7 279 89 ± 1.8 276 84 ± 2.1 262 79 ± 2.3 244 1997 n=313 94 ± 1.4 293 92 ± 1.5 288 90 ± 1.7 283 89 ± 1.8 279 82 ± 2.2 257 - 1998 n=293 97 ± 1.1 283 95 ± 1.3 278 94 ± 1.4 276 91 ± 1.6 268 87 ± 2.0 254 - 1999 n=248 95 1.4 236 94 1.6 232 92 1.8 227 90 2.0 222 - - ± ± ± ± 2000 n=311 97 ± 0.9 303 96 ± 1.0 300 95 ± 1.3 294 94 ± 1.4 291 - - 2001 n=289 96 1.2 277 94 1.4 273 94 1.4 205 - - - ± ± ±
Primary Cadaver Patient Survival 1994 - 2000 Related to Year of Transplant Australia Patient Survival
Primary Cadaver Graft Survival 1994 - 2000 Related to Year of Transplant Australia Graft Survival
Figure 8.17 Primary Cadaver Patient and Graft Survival 1991 - 2001 ± % Survival S.E. / Number at Risk n = Number of Patients Survival Year of Transplant 1 month 3 months 6 months 1 year 3 years 5 years Patient Survival 1991 n=50 100 ± 0.0 50 96 ± 2.8 48 96 ± 2.8 48 96 ± 2.8 48 88 ± 4.6 44 78 ± 5.9 39 1992 n=90 99 ± 1.1 89 97 ± 1.9 87 96 ± 2.2 86 92 ± 2.8 83 86 ± 3.7 77 83 ± 3.9 74 1993 n=53 96 ± 2.6 51 91 ± 4.0 48 89 ± 4.4 47 83 ± 5.2 44 81 ± 5.4 43 72 ± 6.2 38 1994 n=51 96 ± 2.7 49 92 ± 3.8 47 88 ± 4.5 45 88 ± 4.5 45 86 ± 4.8 44 84 ± 5.1 43 1995 n=63 98 ± 1.6 62 97 ± 2.2 61 95 ± 2.7 60 94 ± 3.1 59 90 ± 3.7 57 90 ± 3.7 57 1996 n=63 98 ± 1.6 62 95 ± 2.7 60 94 ± 3.1 59 92 ± 3.4 58 86 ± 4.4 54 81 ± 5.0 51 1997 n=72 99 ± 1.4 71 96 ± 2.4 69 96 ± 2.4 69 96 ± 2.4 69 94 ± 2.7 68 - 1998 n=67 99 ± 1.5 66 97 ± 2.1 65 91 ± 3.5 61 91 ± 3.5 61 87 ± 4.2 58 - 1999 n=59 93 ± 3.3 55 92 ± 3.6 54 92 ± 3.6 54 88 ± 4.2 52 - - 2000 n=63 100 ± 0.0 63 98 ± 1.6 62 98 ± 1.6 62 98 ± 1.6 62 - - 2001 n=62 100 ± 0.0 62 94 ± 3.1 58 94 ± 3.1 32 - - - Graft Survival 1991 n=50 88 ± 4.6 44 84 ± 5.2 42 82 ± 5.4 41 82 ± 5.4 41 74 ± 6.2 37 62 ± 6.9 31 1992 n=90 91 ± 3.0 82 87 ± 3.6 78 83 ± 3.9 75 80 ± 4.2 72 76 ± 4.5 68 73 ± 4.7 65 1993 n=53 85 ± 4.9 45 81 ± 5.4 43 79 ± 5.6 42 74 ± 6.1 39 68 ± 6.4 36 57 ± 6.8 30 1994 n=51 80 ± 5.6 41 78 ± 5.8 40 76 ± 5.9 39 75 ± 6.1 38 71 ± 6.4 36 63 ± 6.8 32 1995 n=63 94 ± 3.1 59 92 ± 3.4 58 90 ± 3.7 57 84 ± 4.6 53 79 ± 5.1 50 75 ± 5.5 47 1996 n=63 89 ± 4.0 56 87 ± 4.2 55 86 ± 4.4 54 84 ± 4.6 53 76 ± 5.4 48 70 ± 5.8 44 1997 n=72 90 ± 3.5 65 88 ± 3.9 63 88 ± 3.9 63 85 ± 4.2 61 83 ± 4.4 60 - 1998 n=67 96 ± 2.5 64 93 ± 3.2 62 87 ± 4.2 58 87 ± 4.2 58 84 ± 4.5 56 - 1999 n=59 86 ± 4.5 51 85 ± 4.7 50 85 ± 4.7 50 78 ± 5.4 46 - - 2000 n=63 92 ± 3.4 58 90 ± 3.7 57 90 ± 4.0 56 89 ± 4.0 56 - - 2001 n=62 97 ± 2.2 60 92 ± 3.5 57 92 ± 3.5 32 - - -
Primary Cadaver Patient Survival 1994 - 2000 Related to Year of Transplant New Zealand Patient Survival
Primary Cadaver Graft Survival 1994 - 2000 Related to Year of Transplant Graft Survival New Zealand
Figure 8.19 Second and Subsequent Cadaver Patient and Graft Survival 1987 - 2001 ± % Survival S.E. / Number at Risk n = Number of Patients Survival Year of Transplant 1 month 3 months 6 months 1 year 3 years 5 years Patient Survival 1987-89 n=199 100 ± 0.0 199 98 ± 1.0 195 96 ± 1.4 191 94 ± 1.6 188 88 ± 2.3 176 81 ± 2.8 162 1990-92 n=194 99 ± 0.7 192 97 ± 1.2 188 95 ± 1.6 184 94 ± 1.7 182 89 ± 2.3 172 83 ± 2.7 161 1993-95 n=179 98 ± 1.0 176 97 ± 1.2 174 97 ± 1.2 174 95 ± 1.6 170 92 ± 2.0 165 87 ± 2.6 155 1996-98 n=158 100 ± 0.0 158 98 ± 1.1 155 97 ± 1.2 154 96 ± 1.5 152 93 ± 2.0 147 85 ± 3.3 51 1999-2001 n=116 98 ± 1.2 114 97 ± 1.7 112 96 ± 1.9 96 95 ± 2.2 80 - - Graft Survival 1987-89 n=199 83 ± 2.6 166 79 ± 2.9 158 76 ± 3.0 152 74 ± 3.1 147 62 ± 3.4 124 57 ± 3.5 114 1990-92 n=194 85 ± 2.6 164 82 ± 2.8 159 80 ± 2.9 155 78 ± 3.0 152 72 ± 3.2 140 63 ± 3.5 122 1993-95 n=179 84 ± 2.7 151 82 ± 2.9 147 82 ± 2.9 146 80 ± 3.0 143 73 ± 3.3 131 67 ± 3.5 120 1996-98 n=158 91 ± 2.3 144 87 ± 2.7 138 87 ± 2.7 137 84 ± 3.0 132 77 ± 3.3 122 67 ± 4.2 39 1999-2001 n=116 91 ± 2.6 106 90 ± 2.8 104 88 ± 3.1 88 86 ± 3.3 73 - -
Second and Subsequent Cadaver Patient Survival Related to Years of Transplant 1987 - 2001 Patient Survival Australia Years
Second and Subsequent Cadaver Graft Survival Related to Years of Transplant 1987 - 2001 Graft Survival Australia Years
Australia Figure 8.22 Living Donor Operations as Proportion (%) of Annual 1997 - 2001 Transplantation Year of Transplantation Recipient Age Groups 1997 1998 1999 2000 2001 00-04 years 100% 67% 100% 83% 86% 05-14 years 60% 47% 58% 63% 75% 15-24 years 57% 54% 61% 65% 68% 25-34 years 44% 37% 39% 38% 37% 35-44 years 27% 32% 41% 35% 37% 45-54 years 18% 21% 26% 25% 40% 55-64 years 10% 21% 27% 23% 27% 65-74 years 0% 19% 0% 25% 33% All Recipients 29% 31% 37% 34% 39%
Percentage Live Donor Grafts - AustraliaStratified by Age Group 1997/2001 Percentage of Transplants
Percentage Live Donor GraftsRegions: Australia and New Zealand Age Group 25-44 Years Percentage of Transplants
Figure 8.25 Timing of Living Donor Transplantation for Primary Grafts in Relation to Date of Dialysis Start by Year 1997 - 2001 1997 1998 1999 2000 2001 Pre-dialysis 19% 17% 19% 21% 22% <1 month post dialysis 5% 4% 4% 7% 4% Aust. 1-5.9 months post dialysis 21% 23% 15% 17% 18% 6-11.9 months post dialysis 15% 20% 18% 15% 16% > 12 months post dialysis 40% 35% 45% 40% 40% Pre-dialysis 21% 32% 24% 50% 26% <1 month post dialysis 0% 0% 0% 0% 3% N.Z. 1-5.9 months post dialysis 17% 21% 21% 18% 20% 6-11.9 months post dialysis 10% 4% 8% 14% 23% > 12 months post dialysis 52% 43% 47% 18% 28%
Figure 8.26 Source of Living Donor Kidney 1997 - 2001 Australia New Zealand Source 1997 1998 1999 2000 2001 1997 1998 1999 2000 2001 Total Living Donors 144 161 167 180 212 31 31 42 31 43 Related (125) (126) (124) (124) (148) (23) (19) (33) (21) (32) Mother 39 27 32 40 34 6 4 9 4 9 Father 22 25 28 35 39 6 5 5 1 7 Brother 29+ 28+ 17 15 x 32 x 3 6 9 6 x 4 Sister 23+ 32 28 22 24 x 5 2 6 10 8 Offspring 3 5 8 8 9 3 2 2 0 4 Grandfather 1 0 1 1 2 0 0 0 0 0 Grandmother 0 4 3 0 1 0 0 0 0 0 Cousin 4 1 5 2 5 0 0 1 0 0 Nephew 0 0 0 0 0 0 0 0 0 0 Niece 1 0 0 0 0 0 0 0 0 0 Uncle 1 0 1 0 0 0 0 0 0 0 Aunt 2 4 1 1 2 0 0 1 0 0 Unrelated (19) (35) (43) (56) (64) (8) (12) (9) (10) (11) Wife 10 17 23 30 21 4 7 4 5 5 Husband 8 13 10 15 23 1 2 3 3 1 Mother in Law 0 0 0 1 0 1 0 0 0 0 Stepmother 0 0 0 0 0 0 0 0 0 0 Adoptive Mother 0 0 0 0 0 0 0 0 0 0 Adoptive Father 0 0 0 0 1 0 0 0 0 0 Stepfather 0 0 0 0 2 0 0 0 0 0 Sister in Law 0 1 1 0 1 1 0 0 0 0 Brother in Law 0 0 0 0 1 0 0 1 0 0 Partner 0 1 0 1 4 0 0 0 0 0 Uncle 0 0 0 0 0 0 0 0 0 0 1 Other 1 3 9 8 11 1 3 2 5 Aunt 0 0 0 1 0 0 0 0 0 0
Figure 8.27 Summary of Renal Transplantation Australia 1963 - 2001 Performed Functioning H First 9223 3535 Second 1458 484 Third 224 68 Cadaver Fourth 30 11 Fifth 2 1 First 1790 1248 Second 159 101 Living Third 22 14 Donor Fourth 5 4 Fifth 1 0 Total 12914 5466 Lost to follow up not included H
Figure 8.28 Summary of Renal Transplantation New Zealand 1965 - 2001 Transplant Performed Functioning H First 1735 656 Second 342 81 Cadaver Third 65 19 Fourth 6 1 First 439 280 Living Second 43 22 Donor Third 4 3 Total 2634 1062 Lost to follow up not included H
Figure 8.29 Functioning Transplants Transplanting State, Australia and New Zealand 1992 - 2001 (Number Per Million Population) Aust. N.Z. Year Qld NSW/ACT Vic./Tas SA/NT WA H H H 1992 688 (227) 1321 (211) 966 (196) 429 (264) 292 (176) 3696 (211) 677 (193) 1993 738 (237) 1355 (215) 1031 (209) 425 (261) 316 (188) 3865 (219) 705 (198) 1994 785 (246) 1415 (223) 1054 (213) 459 (280) 342 (201) 4055 (227) 731 (203) 1995 811 (247) 1478 (230) 1096 (220) 478 (290) 358 (207) 4221 (234) 783 (214) 1996 846 (252) 1546 (238) 1159 (231) 515 (311) 363 (206) 4429 (242) 823 (222) 1997 899 (264) 1631 (248) 1224 (241) 539 (323) 377 (210) 4670 (252) 881 (234) 1998 942 (273) 1674 (252) 1292 (252) 582 (347) 396 (216) 4886 (261) 934 (246) 1999 955 (272) 1709 (254) 1332 (257) 621 (368) 432 (232) 5049 (266) 982 (258) 2000 1002 (281) 1754 (259) 1380 (264) 641 (379) 467 (248) 5244 (274) 1020 (266) 2001 1063 (293) 1789 (261) 1450 (274) 669 (394) 495 (259) 5466 (282) 1062 (276) For calculation of Population Related totals, the population of these States were amalgamated H Patients lost to follow up are not included Vic/Tas includes patients transplanted in Tasmania prior to 1975 (one functioning transplant since 1990)
Functioning Transplants by Region 1995 - 2001 Per Million Population Australia AUST234 242 252 261 266 274 282 NZ 214 222 234 246 258 266 276
Prevalence of Functioning Transplants (Per Million Population) 31-Dec-2001 Residents of Australian States and New Zealand No. Pats. 1126 1592 134 1332 113 599 67 514 5477 1051
Prevalence of Functioning Transplants By Age Group Australia 2001 Transplants (5466) Total RRT (12278) (20) (123) (356) (1165) (1902) (2543) (2592) (2457) (1078) (42)
Prevalence of Functioning Transplants By Age Group New Zealand 2001 Transplants (1062) Total RRT (2522) (8) (25) (101) (241) (448) (595) (583) (396) (118) (7)
Figure 8.33 Age of All Functioning Transplant Patients Resident Country at Transplant (31-Dec-2001) Age Groups Donor Graft Total Source No. 00-04 05-14 15-24 25-34 35-44 45-54 55-64 65-74 75-84 > 85 Australia 11 97 221 710 1118 1397 1199 644 68 1 5466 1 1 27 72 331 632 946 917 543 65 1 3535 2 0 1 14 69 121 136 98 42 3 0 484 3 0 1 0 10 24 19 10 4 0 0 68 Cadaver 4 0 0 0 1 4 4 1 1 0 0 11 5 0 0 0 0 0 1 0 0 0 0 1 Total 1 29 86 411 781 1106 1026 590 68 1 4099 1 10 63 131 276 297 259 163 49 0 0 1248 2 0 4 4 21 32 28 7 5 0 0 101 Living Donor 3 0 1 0 0 7 3 3 0 0 0 14 4 0 0 0 2 1 1 0 0 0 0 4 Total 10 68 135 299 337 291 173 54 0 0 1367 New Zealand 3 17 47 142 260 284 192 101 16 0 1062 1 1 6 14 54 142 186 148 90 15 0 656 2 0 1 0 12 27 27 10 3 1 0 81 Cadaver 3 0 0 0 3 4 10 2 0 0 0 19 4 0 0 0 0 0 1 0 0 0 0 1 Total 1 7 14 69 173 224 160 93 16 0 757 1 2 10 31 66 75 56 32 8 0 0 280 2 0 0 2 5 11 4 0 0 0 0 22 Living Donor 3 0 0 0 2 1 0 0 0 0 0 3 Total 2 10 33 73 87 60 32 8 0 0 305
Age Distribution of Functioning Transplants By Country of Transplant Australia 2001 Transplants (n=5466)
Age Distribution of Functioning Transplants By Country of Transplant Per Million (282) Australia 2001
Age Distribution of Functioning Transplants By Country of Transplant Transplants (n=1062) New Zealand 2001
Age Distribution of Functioning Transplants By Country of Transplant Per Million (276) New Zealand 2001
Figure 8.35 Functioning Transplant Patients Related to Race and Age Group 31-Dec-2001 Age Groups Sex Racial Origin Total 00-04 05-14 15-24 25-34 35-44 45-54 55-64 65-74 75-84 85-94 Australia 11 97 221 710 1118 1397 1199 644 68 1 5466 Caucasoid 4 33 71 265 396 434 426 305 32 0 1966 Aboriginal 0 2 1 6 14 12 12 2 0 0 49 Torres St. Isl. 0 0 0 0 1 2 0 0 0 0 3 Female Asian 0 1 8 13 33 57 24 8 1 0 145 Other 0 6 3 6 7 10 7 2 0 0 41 Total 4 42 83 290 451 515 469 317 33 0 2204 Caucasoid 7 49 121 378 610 773 668 308 33 1 2948 Aboriginal 0 1 5 8 9 28 14 3 0 0 68 Torres St. Isl. 0 0 0 0 0 0 1 1 0 0 2 Male Asian 0 4 7 25 43 61 35 12 2 0 189 Other 0 1 5 9 5 20 12 3 0 0 55 Total 7 55 138 420 667 882 730 327 35 1 3262 New Zealand 3 17 47 142 260 284 192 101 16 0 1062 Caucasoid 0 8 15 47 76 84 59 35 6 0 330 Maori 0 1 1 7 13 10 8 4 0 0 44 Female Pacific Isl. 0 0 1 2 4 5 6 1 0 0 19 Asian 0 0 3 1 12 10 1 1 0 0 28 Total 0 9 20 57 105 109 74 41 6 0 421 Caucasoid 2 7 19 75 129 137 85 54 10 0 518 Maori 0 0 2 6 13 18 16 4 0 0 59 Pacific Isl. 1 0 3 4 4 6 6 1 0 0 25 Male Asian 0 1 3 0 9 12 11 1 0 0 37 Other 0 0 0 0 0 2 0 0 0 0 2 Total 3 8 27 85 155 175 118 60 10 0 641
Number and Duration of Functioning GraftsCaring Country - Australia 2001 All Functioning Grafts (5466)
Number and Duration of Functioning GraftsCaring Country - New Zealand 2001 All Functioning Grafts (1062)
Figure 8.37 Graft Loss Rate 1997 - 2001 (Number of Grafts at Risk) 1997 1998 1999 2000 2001 Australia (4931) (5188) (5339) (5579) (5784) Graft Failure 2.9% 3.0% 3.0% 2.7% 2.7% Death 2.2% 2.3% 2.2% 2.9% 2.4% All Losses 5.1% 5.3% 5.2% 5.6% 5.2% New Zealand (935) (987) (1046) (1088) (1130) Graft Failure 2.6% 2.9% 3.9% 3.4% 3.7% Death 2.8% 2.5% 2.1% 2.5% 2.1% All Losses 5.4% 5.4% 6.0% 6.0% 5.8%
Figure 8.38 Year of Graft Loss Due to Death or Failure 1992 - 2001 By Country of Transplant Loss Cause of Failure 1992 1993 1994 1995 1996 1997 1998 1999 2000 2001 Total Australia Death 104 111 108 118 113 110 124 118 165 144 1215 Rejection - Acute 20 15 9 15 16 6 7 5 6 7 106 Rejection - Chronic 74 90 76 74 87 78 105 104 90 107 885 Rejection - Hyperacute 4 4 0 4 2 1 0 2 1 0 18 Rejection - Subacute 1 3 3 5 3 2 4 2 3 0 26 Failed Vascular 17 24 14 16 13 15 9 15 7 11 141 Technical Problems 4 5 3 4 1 3 0 3 4 2 29 Recurrence Primary Disease 15 11 11 13 7 19 10 10 16 9 121 Non Compliance 10 9 2 3 4 7 6 5 7 7 60 Other 10 12 10 13 15 13 15 15 17 18 138 Total 259 284 236 265 261 254 280 279 316 305 2739 New Zealand Death 11 17 18 14 26 27 25 22 28 24 212 Rejection - Acute 9 6 3 3 3 1 0 3 0 1 29 Rejection - Chronic 16 17 18 11 12 14 19 24 20 29 180 Rejection - Hyperacute 0 0 2 0 1 0 0 0 0 0 3 Rejection - Subacute 4 2 2 2 0 0 1 1 0 0 12 Failed Vascular 0 4 4 2 4 5 0 6 8 1 34 Technical Problems 1 5 1 1 0 2 0 2 0 2 14 Recurrence Primary Disease 1 1 3 4 2 0 3 4 3 2 23 Non Compliance 2 1 1 0 1 0 3 0 5 2 15 Other 1 2 5 5 6 2 3 1 2 5 32 Total 45 55 57 42 55 51 54 63 66 66 554
Figure 8.39 AUSTRALIA Immunosuppressive Therapy - Primary Cadaver Graft 1993 - 2001 Tac / Year Cya /Aza Cya / MMF Tac / Aza Cya / Sirol Sirol / MMF Other Total MMF 1993 253 (78%) 51 (16%) 0 0 0 0 19 (6%) 323 1994 274 (96%) 0 3 (1%) 0 0 0 9 (3%) 286 1995 240 (83%) 0 22 (8%) 0 0 0 28 (10%) 290 1996 264 (85%) 6 (2%) 0 0 18 (6%) 0 23 (7%) 311 Initial 1997 127 (41%) 126 (40%) 0 1 (0%) 36 (12%) 0 23 (7%) 313 treatment 1998 34 (12%) 163 (56%) 0 1 (0%) 67 (23%) 0 28 (10%) 293 1999 19 (8%) 142 (57%) 1 (0%) 33 (13%) 22 (9%) 1 (0%) 30 (12%) 248 2000 20 (6%) 183 (59%) 0 80 (26%) 0 4 (1%) 24 (8%) 311 2001 15 (5%) 180 (62%) 1 (0%) 32 (11%) 0 0 61 (21%) 289 1993 229 (71%) 46 (14%) 0 0 0 0 48 (15%) 323 1994 249 (87%) 0 3 (1%) 0 0 0 34 (12%) 286 1995 228 (79%) 1 (0%) 23 (8%) 0 0 0 38 (13%) 290 1996 228 (73%) 23 (7%) 3 (1%) 2 (1%) 15 (5%) 0 40 (13%) 311 Treatment at 1997 99 (32%) 133 (42%) 0 5 (2%) 35 (11%) 0 41 (13%) 313 1 month 1998 26 (9%) 169 (58%) 0 7 (2%) 65 (22%) 1 (0%) 25 (9%) 293 1999 13 (5%) 135 (54%) 2 (1%) 41 (17%) 23 (9%) 2 (1%) 33 (13%) 248 2000 19 (6%) 170 (55%) 5 (2%) 94 (30%) 1 (0%) 5 (2%) 17 (5%) 311 2001 12 (4%) 159 (55%) 3 (1%) 53 (18%) 0 1 (0%) 61 (21%) 289 1993 228 (79%) 45 (16%) 0 0 0 0 15 (5%) 288 1994 246 (92%) 0 4 (1%) 0 0 0 18 (7%) 268 1995 223 (82%) 3 (1%) 23 (8%) 0 0 0 23 (8%) 272 1996 218 (77%) 26 (9%) 8 (3%) 4 (1%) 14 (5%) 0 14 (5%) 284 Treatment at 1997 89 (31%) 136 (47%) 1 (0%) 5 (2%) 25 (9%) 1 (0%) 31 (11%) 288 3 months 1998 23 (8%) 168 (60%) 1 (0%) 11 (4%) 57 (21%) 1 (0%) 17 (6%) 278 1999 13 (6%) 129 (56%) 4 (2%) 45 (19%) 19 (8%) 3 (1%) 20 (9%) 232 2000 19 (6%) 158 (53%) 7 (2%) 96 (32%) 0 5 (2%) 15 (5%) 300 2001 12 (4%) 143 (52%) 4 (1%) 56 (21%) 0 3 (1%) 55 (20%) 273 1993 221 (79%) 44 (16%) 0 0 0 0 16 (6%) 281 1994 240 (92%) 0 3 (1%) 0 0 0 19 (7%) 262 1995 215 (82%) 3 (1%) 18 (7%) 0 0 0 27 (10%) 263 1996 212 (76%) 25 (9%) 8 (3%) 4 (1%) 13 (5%) 0 18 (6%) 280 Treatment 1997 93 (33%) 140 (49%) 1 (0%) 5 (2%) 22 (8%) 0 22 (8%) 283 at 1998 23 (8%) 166 (60%) 1 (0%) 15 (5%) 44 (16%) 4 (1%) 23 (8%) 276 6 months 1999 15 (7%) 125 (55%) 4 (2%) 44 (19%) 8 (4%) 3 (1%) 28 (12%) 227 2000 21 (7%) 144 (49%) 9 (3%) 93 (32%) 0 3 (1%) 24 (8%) 294 2001 9 (4%) 95 (45%) 3 (1%) 49 (23%) 0 4 (2%) 49 (23%) 209 1993 216 (78%) 38 (14%) 0 0 0 0 22 (8%) 276 1994 234 (90%) 0 2 (1%) 1 (0%) 0 0 22 (8%) 259 1995 211 (81%) 2 (1%) 13 (5%) 1 (0%) 0 0 33 (13%) 260 1996 200 (72%) 32 (12%) 7 (3%) 3 (1%) 12 (4%) 0 22 (8%) 276 Treatment at 1997 106 (38%) 124 (44%) 3 (1%) 4 (1%) 19 (7%) 0 23 (8%) 279 12 months 1998 29 (11%) 158 (59%) 2 (1%) 18 (7%) 34 (13%) 7 (3%) 20 (7%) 268 1999 16 (7%) 118 (53%) 3 (1%) 43 (19%) 5 (2%) 3 (1%) 34 (15%) 222 2000 28 (10%) 126 (43%) 10 (3%) 91 (31%) 0 4 (1%) 32 (11%) 291 2001 3 (4%) 36 (54%) 1 (1%) 19 (28%) 0 0 8 (12%) 67
Figure 8.40 NEW ZEALAND Immunosuppressive Therapy - Primary Cadaver Graft 1993 - 2001 Year Cya /Aza Cya / MMF Tac / Aza Tac / MMF Other Total 1993 50 (94%) 0 0 0 3 (6%) 53 1994 43 (84%) 0 0 0 8 (16%) 51 1995 59 (94%) 0 0 0 4 (6%) 63 1996 60 (95%) 0 0 0 3 (5%) 63 Initial 1997 65 (90%) 2 (3%) 0 0 5 (7%) 72 treatment 1998 34 (51%) 30 (45%) 0 1 (1%) 2 (3%) 67 1999 0 57 (97%) 0 2 (3%) 0 59 2000 0 60 (95%) 0 3 (5%) 0 63 2001 0 59 (95%) 0 3 (5%) 0 62 1993 45 (85%) 0 0 0 8 (15%) 53 1994 39 (76%) 0 0 0 12 (24%) 51 1995 57 (90%) 0 0 0 6 (10%) 63 1996 50 (79%) 3 (5%) 0 0 10 (16%) 63 Treatment at 1997 60 (83%) 5 (7%) 0 0 7 (10%) 72 1 month 1998 33 (49%) 29 (43%) 0 2 (3%) 3 (4%) 67 1999 0 48 (81%) 0 4 (7%) 7 (12%) 59 2000 0 51 (81%) 0 7 (11%) 5 (8%) 63 2001 0 54 (87%) 0 6 (10%) 2 (3%) 62 1993 42 (95%) 0 0 0 2 (5%) 44 1994 39 (98%) 0 0 0 1 (3%) 40 1995 56 (97%) 0 0 0 2 (3%) 58 1996 51 (93%) 3 (5%) 0 0 1 (2%) 55 Treatment at 1997 52 (83%) 7 (11%) 2 (3%) 0 2 (3%) 63 3 months 1998 30 (48%) 28 (45%) 0 3 (5%) 1 (2%) 62 1999 0 46 (92%) 0 4 (8%) 0 50 2000 0 47 (82%) 0 8 (14%) 2 (4%) 57 2001 0 47 (82%) 1 (2%) 6 (11%) 3 (5%) 57 1993 40 (95%) 0 0 0 2 (5%) 42 1994 36 (92%) 0 0 0 3 (8%) 39 1995 55 (96%) 0 0 0 2 (4%) 57 1996 51 (94%) 02 (4%) 0 0 1 (2%) 54 Treatment 1997 50 (79%) 6 (10%) 3 (5%) 1 (2%) 3 (5%) 63 at 1998 28 (48%) 27 (47%) 0 2 (3%) 1 (2%) 58 6 months 1999 0 41 (82%) 0 8 (16%) 1 (2%) 50 2000 3 (5%) 42 (75%) 0 10 (18%) 1 (2%) 56 2001 0 29 (85%) 0 4 (12%) 1 (3%) 34 1993 38 (97%) 0 0 0 1 (3%) 39 1994 35 (92%) 0 0 0 3 (8%) 38 1995 51 (96%) 0 0 0 2 (4%) 53 1996 49 (92%) 2 (4%) 0 0 2 (4%) 53 Treatment at 1997 45 (74%) 10 (16%) 1 (2%) 1 (2%) 4 (7%) 61 12 months 1998 32 (55%) 18 (31%) 3 (5%) 2 (3%) 3 (5%) 58 1999 12 (26%) 24 (52%) 2 (4%) 6 (13%) 2 (4%) 46 2000 19 (34%) 22 (39%) 3 (5%) 11 (20%) 1 (2%) 56 2001 6 (50%) 4 (33%) 1 (8%) 1 (8%) 0 12 There were no patients treated with Cyclosporin/Sirolimus or Sirolimus/Mycophenolate immunosuppressive therapy