1 / 40

Figure 8.1 A simple strain gage.

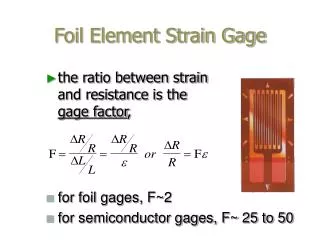
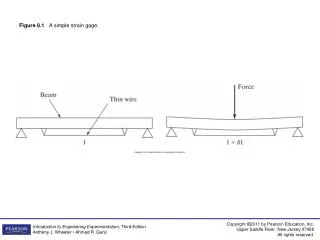
Figure 8.1 A simple strain gage. Figure 8.2 Foil strain gage. Figure 8.3 Orientation of strain gages in common rosettes: (a) rectangular; (b) equiangular. Figure 8.4 Strain-gage rosette. Figure 8.5 Constant-voltage Wheatstone bridge.

Download Presentation

Figure 8.1 A simple strain gage.

An Image/Link below is provided (as is) to download presentation Download Policy: Content on the Website is provided to you AS IS for your information and personal use and may not be sold / licensed / shared on other websites without getting consent from its author. Content is provided to you AS IS for your information and personal use only. Download presentation by click this link. While downloading, if for some reason you are not able to download a presentation, the publisher may have deleted the file from their server. During download, if you can't get a presentation, the file might be deleted by the publisher.

E N D

Presentation Transcript


  1. Figure 8.1 A simple strain gage.

  2. Figure 8.2 Foil strain gage.

  3. Figure 8.3 Orientation of strain gages in common rosettes: (a) rectangular; (b) equiangular.

  4. Figure 8.4 Strain-gage rosette.

  5. Figure 8.5 Constant-voltage Wheatstone bridge.

  6. Figure 8.6 Typical temperature effects on strain gage.

  7. Figure 8.7 Multiple strain gages: switching within bridge.

  8. Figure 8.8 Multiple strain gages: switching outside of bridge.

  9. Figure 8.9 Linear potentiometer.

  10. Figure 8.10 Angular potentiometer.

  11. Figure 8.11 Schematic LVDT.

  12. Figure 8.12 LVDT sensor output.

  13. Figure 8.13 LVDT cross section.

  14. Figure 8.14 Rotary variable differential transformer: (a) schematic; (b) simplified construction. [(b) Based on Herceg, 1976.]

  15. Figure 8.15 Output voltage versus time for LVDT: (a) core displaced upward from center; (b) core displaced down from center.

  16. Figure 8.16 LVDT system block diagram.

  17. Figure 8.17 Linear portion of conditioned output of LVDT system.

  18. Figure 8.18 Capacitive displacement transducer.

  19. Figure 8.19 Wheatstone bridge for capacitance measurement.

  20. Figure 8.20 Angular digital encoder: (a) binary shaft encoder; (b) side view. (Based on Turner, 1988.)

  21. Figure 8.21 Linear velocity transducer.

  22. Figure 8.22 Two-winding linear velocity transducer (LVT). (Based on Herceg, 1976.).

  23. Figure 8.23 Doppler velocity measurement.

  24. Figure 8.24 Magnetic pickup for angular velocity measurement.

  25. Figure 8.25 Pulsed output of magnetic-pickup transducer.

  26. Figure 8.26 Stroboscopic tachometer.

  27. Figure 8.27 Photoelectric tachometer.

  28. Figure 8.28 Piezoelectric sensors: (a) longitudinal effect; (b) transverse effect.

  29. Figure 8.29 Charge amplifier for piezoelectric sensor.

  30. Figure 8.30 Schematic piezoelectric accelerometer.

  31. Figure 8.31 Strain-gage accelerometer.

  32. Figure 8.32 Servo accelerometer. (Based on Lucas Schaevitz literature.)

  33. Figure 8.33 Vibrometer.

  34. Figure 8.34 Common types of load cells: (a) cantilever beam; (b) hollow cylinder.

  35. Figure 8.35 Proving ring for force measurement.

  36. Figure 8.36 Electric-motoring dynamometer.

  37. Figure 8.37 Eddy-current dynamometer.

  38. Figure 8.38 Shaft torque meter.

  39. Figure 8.39 Shaft torque meter with electric output signal.

  40. Figure P8.14

More Related