Download
1 / 1
20 likes | 238 Views
Table 3. Expert opinions on the 25 GCA questions Query to experts Agreement of experts >90% >80% >70% Number of Questions The question tests achievement of the specified learning goal 21 3 1

E N D
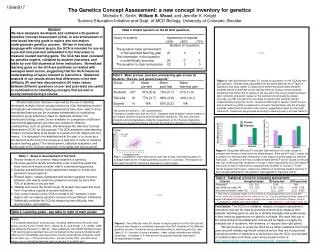
Table 3. Expert opinions on the 25 GCA questions Query to experts Agreement of experts >90% >80% >70% Number of Questions The question tests achievement of the specified learning goal 21 3 1 The information in the question is scientifically accurate. 25 0 0 The question is clear and precise 22 3 0 Table 4. Mean pre-test, post-test, and learning gain scores for students, TAs/LAs, and genetics experts1 Group n2 Mean Mean Mean pre-test post-test learning gain Students 607 41% (0.6) 74% (0.7) 57% (1.0) TAs/LAs 18 77% (3.7) 88% (3.8) 40% (12.1) Experts 10 NA 93% (5.2) NA 1 All scores are shown +/- SE (parentheses). 2 Number of people who took the GCA. Students were enrolled in either majors or non-majors genetics courses at three different institutions. TAs and LAs were graduate and undergraduate students, respectively, at CU.Scores of genetics experts from several institutions who took the GCA are included for comparison. Figure 3. Item discrimination index (D) values for questions on the GCA pre-test and post-test. Results were calculated from the same data set as in Figure 2. Questions that have higher D values more effectively discriminate between students whose overall test scores identify them as strong or weak students. Questions that show high D values on the pre-test (only strong students answer them correctly) and low D values on the post-test (most students answer correctly, e.g. #8) correspond to concepts on which most students gained understanding during the course. Questions with high D values on both the pre- and post-tests (e.g.#12) correspond to concepts that primarily only the stronger students understood at the end of the course, suggesting a need for improved instruction. Questions are grouped according to learning goal (LG) (see Table 2). Figure 4. Using item difficulty (P) and item discrimination (D) index values to compare two modes of instruction for effectiveness. Bars show P and D values for a question on mitochondrial inheritance in two majors courses taught by different instructors. Students in the two courses showed similar P and D values on the pre-test, but on the post-test, students in Course 1 had a significantly (p<0.05) higher P value and a lower D value when compared with students in Course 2. These results suggest that Course 1 was more effective in promoting student learning of the concept addressed in this question(see legends to Figures 2 and 3). Figure 2. Item difficulty index (P) values for each question on the GCA pre-test and post-test. Based on combined responses from 607 students in five different genetics courses. Questions are grouped according to learning goal (LG) (see Table 2). P = fraction of correct answers - lower values indicate more difficult questions). Increases in P from pre-testto post-testindicate learning for corresponding concepts. Fig. 1. Correlations of pre-test scores, post-test scores, and learning gains vs. average exam score in majors genetics course at U. Colorado. The equation of the trend line and R2 values are displayed on each graph. 1566/B17 The Genetics Concept Assessment: a new concept inventory for genetics Michelle K. Smith, William B. Wood, and Jennifer K. Knight Science Education Initiative and Dept. of MCD Biology, University of Colorado, Boulder Abstract We have designed, developed, and validated a 25-question Genetics Concept Assessment (GCA), to test achievement of nine broad learning goals in majors and non-majors undergraduate genetics courses. Written in everyday language with minimal jargon, the GCA is intended for use as a pre-test and post-test (embedded in the final exam) to measure student learning gains. The GCA has been reviewed by genetics experts, validated by student interviews, and taken by over 600 students at three institutions. Normalized learning gains on the GCA are positively correlated with averaged exam scores, suggesting that the GCA measures understanding of topics relevant to instructors. Statistical analysis of our results shows that differences in the item difficulty (P) and item discrimination (D) index values between different questions on pre- and post-tests are useful in combination for identifying concepts that are well or poorly learned during a course. Physics instruction has been improved by the use of carefully developed multiple-choice concept inventories (CIs) that assess student conceptual understanding. Such assessments have been used to show that student learning can be increased substantially by substituting interactive group activities in class for traditional lectures. For introductory biology, a few CIs are available for comparison of different instructional approaches, but more are needed for different subdisciplines, such as genetics. We developed the Genetics Concept Assessment (GCA)1for this purpose. The GCA assesses understanding of basic concepts likely to be taught in courses for both majors and non-majors. It is designed to be administered at the start of a course as a pre-test and at the end of the course as a post-test, in order to measure student learning gains.2The development, statistical evaluation, and some uses of the GCA are described in the tables and figures below. Table 1. Steps in development of the GCA 1. Review literature on common misconceptions in genetics. 2. Interview genetics faculty and develop a set of learning goals that most instructors would consider vital to understanding genetics. 3. Develop and administer a pilot assessment based on known and perceived misconceptions. 4. Reword jargon, replace distracters with student supplied incorrect answers, and rewrite questions answered correctly by more than 70% of students on the pre-test. 5. Validate and revise the GCA through 33 student interviews and input from 10 genetics experts at several institutions. 6. Give current version of the GCA to a total of 607 students in both majors and non-majors genetics courses at three different institutions 7. Statistically evaluate the GCA by measuring item difficulty, item discrimination, and reliability. Table 5. Statistical criteria for evaluating assessments Criterion Accepted range1 GCA pre-test GCA post-test Reliability20.8 - 0.9 0.93 NA Item difficulty index (P) 0.3 - 0.8 0.09 - 0.69 0.48 - 0.92 Item discrimination index (D) > 0.3 0.11 - 0.6010.15 - 0.581 1 Note that the accepted ranges for P and D are for standardized tests such as the SAT. These criteria are not appropriate for evaluation of CIs.* E.g. it is precisely the wide range of D values that makes this statistic useful in judging the success of instruction (Figures 3 and 4). 2 Coefficient of stability, test-retest method. * See reference 1 under Notes, lower left. Conclusion. The GCA is a validated, reliable conceptual assessment instrument that can be used by genetics instructors to measure their students’ learning gains as well as to identify strengths and weaknesses in their teaching approaches for specific concepts. We hope that use of the GCA will become widespread, and we will be happy to supply the complete set of questions, with answers, on request (see right panel). We will continue to revise the GCA as we obtain feedback from GCA users and will validate significant revisions before they are incorporated. A growing number of institutions is planning to use the GCA, and analysis of combined data from these users will be posted online at http://www.colorado.edu/sei/departments/mcdb_assessment.htm. Table 2. Learning goals - see table to right of main poster Notes: 1A complete description of this project, including references to the work cited above, can be found in Smith, M. K., Wood, W. B., and Knight, J. K. (2008) CBE-Life Sciences Education 7: 422-30. (Also published in the 2008 Highlights Issue.) 2All learning gains reported here are normalized so that gains for students with differing prior knowledge (pre-test scores) can be meaningfully compared, using the formula <g> = 100 (post-test score - pre-test score)/(100 - pre-test score) where <g> is normalized learning gain as percent of possible gain.