Download
1 / 19
190 likes | 478 Views
AIRS Profile Evaluation and Assimilation Bradley Zavodsky Gary Jedlovec Shih-hung Chou November 21, 2005. Motivation for Evaluating AIRS Profiles AIRS Science Team has done extensive global validation Quantify regional errors in the AIRS soundings (collaborative with OU EOS activity)

E N D
AIRS Profile Evaluation and Assimilation Bradley Zavodsky Gary Jedlovec Shih-hung Chou November 21, 2005
Motivation for Evaluating AIRS Profiles AIRS Science Team has done extensive global validation Quantify regional errors in the AIRS soundings (collaborative with OU EOS activity) Apply knowledge of localized errors to tune parameters for regional data assimilation High-End Methodology RMS errors between regional RAOBs and collocated AIRS soundings for January 2004 (supports January 14-17 case study) Analyze differences between quality indicators in the AIRS V4.0 retrievals
AIRS Data – January 14-17, 2004 Retrieval QI Flags (Vers. 4.0) Temperature and moisture profiles • ≈ 50km spacing • 1 K in 1 km layer for T • 20% in 2 km layers for RH • profiles assigned quality values by science team Quality indicators • identify retrieval process • layer quality checks • only temperature for V4.0 2329 UTC 2141 UTC Full retrieval Sfc flagged Sfc+Bot flagged Sfc+Bot+Mid flagged All levels flagged No retrieval IR image 15 January 2004 0030 UTC Distribution of AIRS Data by QI
Collaborative work with Keith Brewster (CAPS, OU) has shown that AIRS data should be spread vertically over 1500 m layers in analysis systems Results for January 2004 compares favorably QIs have congruent trends but different magnitudes Application to Analysis Systems: AIRS Vertical Layers 700 hPa All retrievals Sfc + Bot flagged Sfc + Bot + Mid flagged Full Sfc flagged All Levels flagged
Application to Analysis Systems: Error Tables How do we use this information in ADAS? 1500 m layer average All retrievals Sfc + Bot flagged Sfc + Bot + Mid flagged Full Sfc flagged All Levels flagged RMS errors improve as data quality improves Errors slightly larger than AIRS Science Team values (0.9-1.3K, 20% globally) Temperature trend as expected; moisture influenced by marine inversion Generate analysis error tables using these results
AIRS Data Assimilation in WRF Establish assimilation methodology and demonstrate short term weather forecast improvement with AIRS profiles FY04: Initial case studies over SEUS (reported on last year) • LAPS/MM5 (previous experience with surface fields) • AIRS Vers.3.6 un-validated soundings (mainly over land) • Limited quality flags Previous work: Limited impact (mainly upper level temperature) FY05: Adapt methodologies for ADAS / WRF - west coast US winter-time storm system (14-16 January 2004) • ADAS (flexibility, tunable for unique datasets) • WRF- operational use by NCEP • AIRS Vers.4.0 validated soundings – T & q ocean profiles only • T - quality flags important for proper data assimilation
January 14-17, 2004 Case Study Slow moving synoptic system off west coast – inadequate forecasts with conventional models 2141 UTC Case selection • weather system over ocean • varied cloud cover • coverage from AIRS – multiple assimilation times • availability of AIRS version 4.0 profiles • applicable to SPoRT SEUS situations (data void over Gulf) 2329 UTC Infrared image on 15 January 2004
ADAS Bratseth Method Used iteratively to update a first-guess (or background) field provided by a model forecast. The correction, , at each grid point is given by where x(k+1) is the analysis for the kth iteration, x(k)is the analysis value at the grid point (background value if k =1), [iobs - i(k)] is the value of the innovations (obs. - bckgrd), and xi is the weighting function. The xiis a function of observation and background error variances (error tables), distance of the observations from the grid point and is proportional to where rij and Δzij - horizontal / vertical distances between obs. and grid R and Rz - horizontal and vertical scaling factors.
Vertical Resolution Factor Changes Influence of AIRS varies with ADAS constraints ADAS Horizontal and Vertical Resolution Factors Resolution factors can control influence of AIRS data on resulting assimilated field • select factors consistent with AIRS vertical and horizontal resolution • relative magnitude w.r.t other assimilated data is important ADAS Resolution Factors used with AIRS Profiles
Moisture Temperature Influence of Data Type in ADAS While error variances useful to quantify data errors, “representativeness” of the data type is important to establish relative weights of each data input • Vertical resolution and accuracy of AIRS – varies between T, q • Interplays with vertical/horizontal influence factors Data source weights used in ADAS – no raob If raobs are also assimilated, relative weights of AIRS data should be reduced (i.e., AIRS error table values should be increased) Background AIRS AIRS Background AIRS values taken from V4.0 validation results
Bckgrd+AIRS+MADIS ADAS Background AIRS analysis Impact of DA ADAS and AIRS Data Assimilation AIRS assimilated 850mb T at 2200UTC on 14 January 2004 - 4h WRF as background ADAS example: • WRF 4h forecast (upper left) used as background for 2200UTC assimilation • analysis of AIRS data (lower left) with selected QIs • AIRS and MADIS data assimilated to produce new analysis field (upper right) • impact of assimilation (mainly AIRS data seen in difference field (lower right) – 0.5-1.0C changes AIRS changes the analysis – does it change the forecast?
30km domain with 37 vertical levels Initialized with NCEP 1° GFS grids, with 6-h forecasts used as LBC Numerical experiments: Control (CNTL): Conventional meteorological data (NO AIRS) AIRS Best Quality (FULL): Conventional AND full-retrieval AIRS Surface & Bottom Fail (SFBT): Surface- and bottom-failed AIRS SPoRT Research WRF for AIRS Assimilation
Validation region 2141 UTC AIRS Swath 48h WRF Forecast initialized from ADAS analysis at 00 UTC 2329 UTC AIRS Swath ADAS ADAS 4h WRF Forecast 2h WRF Forecast 18 UTC 1/14 22 UTC 00 UTC 1/17 00 UTC 1/15 Validation every 12 h Assimilation Cycles
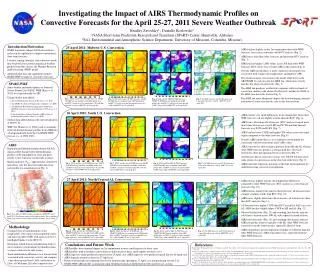
L AIRS FULL minus CNTL AIRS impact on simulation + 2 ºC (significant differences) Weaker thermal gradient along 500 hPa front Impact of AIRS Data on Temperature Forecast24-hour Forecast Valid at 00 UTC January 16 2004: 500 hPa L CNTL 500 hPa Temperature
1.6 1.2 0.8 0.4 -0.4 -0.8 -1.2 -1.6 -2.0 L AIRS FULL minus CNTL AIRS impacts moisture +2 g/Kg Less intense frontal boundary—consistent with 500 hPa temp analysis Impact of AIRS Data on Moisture Forecast24-hour Forecast Valid at 00 UTC January 16 2004: 700 hPa L CNTL 700 hPa Mixing Ratio
Verification Statistics 24h fcst valid 00 UTC 16 Jan 2004 CNTL • Temp RMSE increases with height • Moisture RMSE decreases with height FULL (16%) • Slight T improvement 600 to 250 hPa • Degrades q at 700 hPa and below SFBT (60%) • More significant T improvement between 600 and 250 hPa • Improved moisture 700 to 500 hPa but degradation below 700 hPa
NEWT Error Tables Reduce impact of lower quality AIRS by increasing error values Retain impact of higher quality AIRS above failed quality layer
Verification Statistics 24h fcst valid 00 UTC 16 Jan 2004 CNTL • Temp RMSE increases with height • Moisture RMSE decreases with height FULL (16%) • Slight T improvement 600 to 250 hPa • Degrades q at 700 hPa and below SFBT (60%) • More significant T improvement between 600 and 250 hPa • Improved moisture 700 to 500 hPa but degradation below 700 hPa NEWT • Improves moisture forecast near the surface • The suppression of poor-quality low- level information are not fully achieved – need a new error table
ADAS/WRF Summary Assimilation of AIRS profiles can have a positive impact on short-term weather forecasts • Make prudent use of AIRS profiles based on quality indicators (QIs) • Adapt ADAS parameters to represent AIRS vertical / horizontal resolution • Construct error profiles tailored for AIRS and relative to other data sets Working closely with AIRS science team (Susskind) on QIs • quality at each level • separate indicators for T and q Need for more case studies Evaluate use of AIRS vers. 5.0 retrievals Smart data thinning based on QIs, meteorological gradients,etc.