Download
1 / 1
10 likes | 123 Views
Investigating the Impact of AIRS Thermodynamic Profiles on Convective Forecasts for the April 25-27, 2011 Severe Weather Outbreak. Bradley Zavodsky 1 , Danielle Kozlowski 2 1 NASA Short-term Prediction Research and Transition (SPoRT) Center, Huntsville, Alabama

E N D
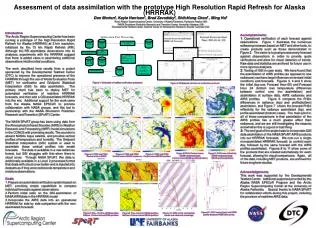
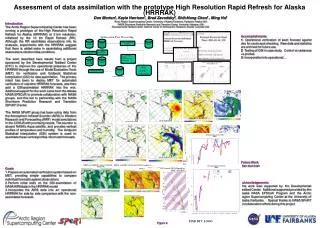
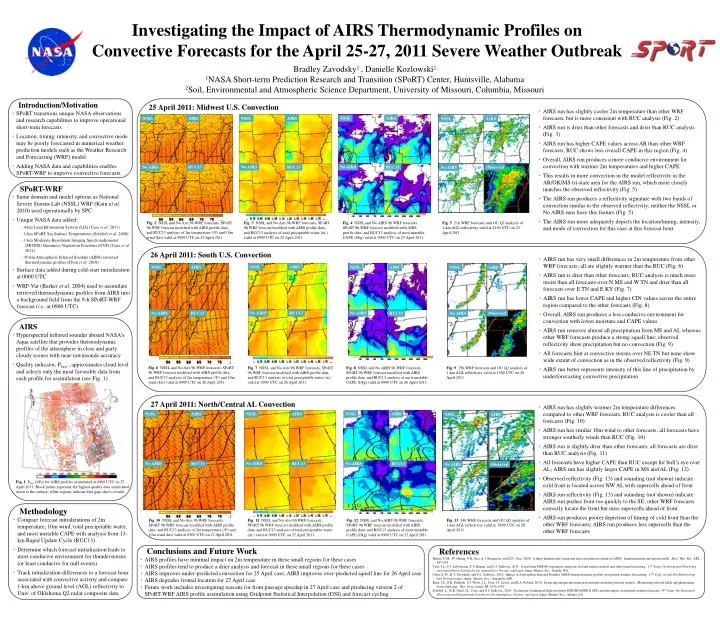
Investigating the Impact of AIRS Thermodynamic Profiles on Convective Forecasts for the April 25-27, 2011 Severe Weather Outbreak Bradley Zavodsky1 , Danielle Kozlowski2 1NASA Short-term Prediction Research and Transition (SPoRT) Center, Huntsville, Alabama 2Soil, Environmental and Atmospheric Science Department, University of Missouri, Columbia, Missouri • Introduction/Motivation • SPoRT transitions unique NASA observations and research capabilities to improve operational short-term forecasts • Location, timing, intensity, and convective mode may be poorly forecasted in numerical weather prediction models such as the Weather Research and Forecasting (WRF) model • Adding NASA data and capabilities enables SPoRT-WRF to improve convective forecasts 25 April 2011: Midwest U.S. Convection • AIRS run has slightly cooler 2m temperature than other WRF forecasts, but is more consistent with RUC analysis (Fig. 2) • AIRS run is drier than other forecasts and drier than RUC analysis (Fig. 3) • AIRS run has higher CAPE values across AR than other WRF forecasts; RUC shows less overall CAPE in this region (Fig. 4) • Overall, AIRS run produces a more conducive environment for convection with warmer 2m temperatures and higher CAPE • This results in more convection in the model reflectivity in the AR/OK/MS tri-state area for the AIRS run, which more closely matches the observed reflectivity (Fig. 5) • The AIRS run produces a reflectivity signature with two bands of convection similar to the observed reflectivity; neither the NSSL or No AIRS runs have this feature (Fig. 5) • The AIRS run more adequately depicts the location/timing, intensity, and mode of convection for this case at this forecast hour NSSL AIRS NSSL AIRS NSSL AIRS NSSL AIRS No AIRS Observed No AIRS RUC13 RUC13 RUC13 No AIRS No AIRS • SPoRT-WRF • Same domain and model options as National Severe Storms Lab (NSSL) WRF (Kain et al. 2010) used operationally by SPC • Unique NASA data added: • - 4-km Land Information System (LIS) (Case et al. 2011) • - 1-km SPoRT Sea Surface Temperatures (Schiferl et al. 2008) • - 1-km Moderate-Resolution Imaging Spectroradiometer (MODIS) Greenness Vegetation Fractions (GVF) (Case et al. 2011) • - 45-km Atmospheric Infrared Sounder (AIRS) retrieved thermodynamic profiles (Chou et al. 2010) • Surface data added during cold-start initialization at 0000 UTC • WRF-Var (Barker et al. 2004) used to assimilate retrieved thermodynamic profiles from AIRS into a background field from the 9-h SPoRT-WRF forecast (i.e. at 0900 UTC) Fig. 2 NSSL and No Airs 9h WRF forecasts, SPoRT 9h WRF forecast modified with AIRS profile data, and RUC13 analysis of 2m temperature (oF) and 10m wind (kts) valid at 0900 UTC on 25 April 2011. Fig. 3 NSSL and No Airs 9h WRF forecasts, SPoRT 9h WRF forecast modified with AIRS profile data, and RUC13 analysis of total precipitable water (in.) valid at 0900 UTC on 25 April 2011. Fig. 4 NSSL and No AIRS 9h WRF forecasts, SPoRT 9h WRF forecast modified with AIRS profile data, and RUC13 analysis of most unstable CAPE (J/kg) valid at 0900 UTC on 25 April 2011. Fig. 5 21h WRF forecasts and OU Q2 analysis of 1-km AGL reflectivity valid at 2100 UTC on 25 April 2011. 26 April 2011: South U.S. Convection • AIRS run has very small differences in 2m temperature from other WRF forecasts; all are slightly warmer than the RUC (Fig. 6) • AIRS run is drier than other forecasts; RUC analysis is much more moist than all forecasts over N MS and W TN and drier than all forecasts over E TN and E KY (Fig. 7) • AIRS run has lower CAPE and higher CIN values across the entire region compared to the other forecasts (Fig. 8) • Overall, AIRS run produces a less conducive environment for convection with lower moisture and CAPE values • AIRS run removes almost all precipitation from MS and AL whereas other WRF forecasts produce a strong squall line; observed reflectivity show precipitation but no convection (Fig. 9) • All forecasts hint at convective storms over NE TN but none show wide extent of convection as in the observed reflectivity (Fig. 9) • AIRS run better represents intensity of this line of precipitation by underforecasting convective precipitation AIRS NSSL NSSL AIRS NSSL AIRS NSSL AIRS Observed No AIRS No AIRS RUC13 No AIRS RUC13 RUC13 No AIRS • AIRS • Hyperspectral infrared sounder aboard NASA’s Aqua satellite that provides thermodynamic profiles of the atmosphere in clear and party cloudy scenes with near-rawinsonde accuracy • Quality indicator, Pbest , approximates cloud level and selects only the most favorable data from each profile for assimilation (see Fig. 1) Fig. 6 NSSL and No Airs 9h WRF forecasts, SPoRT 9h WRF forecast modified with AIRS profile data, and RUC13 analysis of 2m temperature (oF) and 10m wind (kts) valid at 0900 UTC on 26 April 2011. Fig. 7 NSSL and No Airs 9h WRF forecasts, SPoRT 9h WRF forecast modified with AIRS profile data, and RUC13 analysis of total precipitable water (in.) valid at 0900 UTC on 26 April 2011. Fig. 8 NSSL and No AIRS 9h WRF forecasts, SPoRT 9h WRF forecast modified with AIRS profile data, and RUC13 analysis of most unstable CAPE (J/kg) valid at 0900 UTC on 26 April 2011. Fig. 9 15h WRF forecasts and OU Q2 analysis of 1-km AGL reflectivity valid at 1500 UTC on 26 April 2011. NSSL AIRS NSSL AIRS NSSL AIRS NSSL AIRS 27 April 2011: North/Central AL Convection • AIRS run has slightly warmer 2m temperature differences compared to other WRF forecasts; RUC analysis is cooler than all forecasts (Fig. 10) • AIRS run has similar 10m wind to other forecasts; all forecasts have stronger southerly winds than RUC (Fig. 10) • AIRS run is slightly drier than other forecasts; all forecasts are drier than RUC analysis (Fig. 11) • All forecasts have higher CAPE than RUC except for bull’s eye over AL; AIRS run has slightly larger CAPE in MS and AL (Fig. 12) • Observed reflectivity (Fig. 13) and sounding (not shown) indicate cold front is located across NW AL with supercells ahead of front • AIRS run reflectivity (Fig. 13) and sounding (not shown) indicate AIRS run pushes front too quickly to the SE; other WRF forecasts correctly locate the front but miss supercells ahead of front • AIRS run produces poorer depiction of timing of cold front than the other WRF forecasts; AIRS run produces less supercells than the other WRF forecasts No AIRS No AIRS No AIRS RUC13 RUC13 RUC13 No AIRS Observed Fig. 1 Pbest (hPa) for AIRS profiles assimilated at 0900 UTC on 27 April 2011. Black points represent the highest quality data assimilated down to the surface; white regions indicate data gaps due to clouds. • Methodology • Compare forecast initializations of 2m temperature, 10m wind, total precipitable water, and most unstable CAPE with analysis from 13-km Rapid Update Cycle (RUC13) • Determine which forecast initialization leads to most conducive environment for thunderstorms (or least conducive for null events) • Track initialization differences to a forecast hour associated with convective activity and compare 1-km above ground level (AGL) reflectivity to Univ. of Oklahoma Q2 radar composite data Fig. 10 NSSL and No Airs 9h WRF forecasts, SPoRT 9h WRF forecast modified with AIRS profile data, and RUC13 analysis of 2m temperature (oF) and 10m wind (kts) valid at 0900 UTC on 27 April 2011. Fig. 11 NSSL and No Airs 9h WRF forecasts, SPoRT 9h WRF forecast modified with AIRS profile data, and RUC13 analysis of total precipitable water (in.) valid at 0900 UTC on 27 April 2011. Fig. 12 NSSL and No AIRS 9h WRF forecasts, SPoRT 9h WRF forecast modified with AIRS profile data, and RUC13 analysis of most unstable CAPE (J/kg) valid at 0900 UTC on 27 April 2011. Fig. 13 24h WRF forecasts and OU Q2 analysis of 1-km AGL reflectivity valid at 0000 UTC on 28 April 2011. • Conclusions and Future Work • AIRS profiles have minimal impact on 2m temperature in these small regions for these cases • AIRS profiles tend to produce a drier analysis and forecast in these small regions for these cases • AIRS improves under-predicted convection for 25 April case; AIRS improves over-predicted squall line for 26 April case • AIRS degrades frontal location for 27 April case • Future work includes investigating reasons for front passage speedup in 27 April case and producing version 2 of SPoRT-WRF AIRS profile assimilation using Gridpoint Statistical Interpolation (GSI) and forecast cycling References Barker, D.M., W. Huang, Y-R. Guo, A.J. Bourgeois, and Q.N. Xiao, 2004: A three-dimensional variational data assimilation system for MM5: Implementation and initial results. Mon. Wea. Rev., 132, 897-914. Case, J.L., F.J. LaFontaine, S.V. Kumar, and G.J. Jedlovec, 2011: A real-time MODIS vegetation composite for land surface models and short-term forecasting. 15thSymp. On Integrated Observing and Assimilation Systems for the Atmosphere, Oceans, and Land, Amer. Meteor. Soc., Seattle, WA. Chou, S.-H., B.T. Zavodsky, and G.J. Jedlovec, 2010: Impact of Atmospheric Infrared Sounder (AIRS) thermodynamic profiles on regional weather forecasting. 17th Conf. on Satellite Meteorology and Oceanography, Amer. Meteor. Soc., Annapolis, MD. Kain, J.S., S.R. Dembek, S.J. Weiss, J.L. Case, J.J. Levitt, and R.A. Sobash, 2010: Extracting unique information from high-resolution forecast models: Monitoring selected fields and phenomena every time step. Wea. Forecasting, 25, 1536-1542. Schiferl, L., K.K. Fuell, J.L. Case, and G.J. Jedlovec, 2010: Evaluation of enhanced high resolution MODIS/AMSR-E SSTs and the impact on regional weather forecasts. 14thSymp. On Integrated Observing and Assimilation Systems for the Atmosphere, Oceans, and Land, Amer. Meteor. Soc., Atlanta, GA.