Download

1 / 18
200 likes | 248 Views
Explore the fundamentals of market economics in this presentation covering demand, supply, equilibrium, and key market principles such as substitutes, complements, and shifts in demand and supply curves.

E N D
Chapter 3Demand, supply and the market David Begg, Stanley Fischer and Rudiger Dornbusch, Economics, 9th Edition, McGraw-Hill, 2005 PowerPoint presentation by Alex Tackie and Damian Ward
Some key terms Market a set of arrangements by which buyers and sellers are in contact to exchange goods or services Demand the quantity of a good buyers wish to purchase at each conceivable price Supply the quantity of a good sellers wish to sell at each conceivable price Equilibrium price price at which quantity supplied = quantity demanded
Some key terms (2) Some goods are related to each other. Substitutes: If the two goods fulfill similar needs they are called substitutes. E.g. Tea and Coffee. Complements: If the two goods complete each other when consumed, they are called complements. E.g. Tea and sugar.
Some Key Terms (3) • Prices of Related Goods • When a fall in the price of one good reduces the demand for another good, the two goods are called substitutes. • When a fall in the price of one good increases the demand for another good, the two goods are called complements.
Some Key Terms (4) • Consumer Income • As income increases the demand for a normal good will increase. E.g. Cars • As income increases the demand for an inferior good will decrease. E.g Bread
The Demand curve shows the relation between price and quantity demanded holding other things constant “Other things” include: the price of related goods consumer incomes consumer preferences Changes in these other things affect the position of the demand curve Price D Law of Demand: The quantity demanded of a good decreases as its prices increases, all other things equal. Quantity
The Supply curve shows the relation between price and quantity supplied holding other things constant “Other things” include: technology input costs government regulations Changes in these other things affect the position of the demand curve S Price Law of Supply: The quantity supplied of a good increases as its prices increases, all other things equal. Quantity
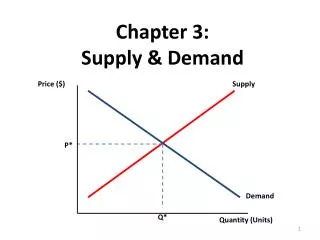
Market equilibrium (1) Market equilibrium is at E0 where quantity demanded equals quantity supplied with price P0 and quantity Q0 D0 S P0 E0 D0 S Q0 Price Quantity
Market equilibrium and disequilibrium If price were below P0 there would be excess demand consumers wish to purchase more than producers wish to supply excess supply P1 P2 excess demand S D Price E P0 • If price were above P0 there would be excess supply • producers wish to supply more than consumers wish to purchase S D Q0 Quantity
A shift in demand D0 D1 P0 E0 P1 The demand curve shifts from D0D0 to D1D1. If price stayed at P0 there would be excess supply. D0 D1 So the market moves to a new equilibrium at E1. Q1 Q0 If the price of a substitute good decreases ... S Price less will be demanded at each price. E1 S Quantity
Shift in demand (2) • Consumer income: • Normal goods: Demand shifts right if the income increases • Inferior goods: Demand shifts left if the income increases. • Preferences: If the change in preference is in favor of the good, the demand will shift to the right. E.g: Ice cream in summer.
Shift in demand (3) • Population increase shifts the market demand curve to the right. • Subsititutes: If a substitute good price increases, the other good’s demand will shift to the right. • Complements: If a complement good’s price increases, the other good’s demand will shift to the left.
A shift in supply S1 S0 E2 The supply curve shifts to S1S1 P1 S1 S0 So the market moves to a new equilibrium at E2 Q1 Suppose safety regulations are tightened, increasing producers’ costs D Price P0 E0 If price stayed at P0 there would be excess demand D Q0 Quantity
Shift in supply (2) • Increase in input’s price shift the supply curve to the left. • Taxes shifts the supply curve to the left. • Expectation about future consumers shifts the supply curve to the right. • External conditions also shift the supply curve. E.g Weather conditions for agricultural products.
Two ways in which demand may increase (1) (1) A movementalong the demand curve from A to B represents consumer reaction to a price change could follow a supply shift B P1 Q1 Price A P0 D Q0 Quantity
Two ways in which demand may increase (2) (2) A movementofthe demand curve from D0 to D1 leads to an increase in demand at each price e.g. at P0 quantity demanded increases from Q0 to Q2: at P1 quantity demanded increases from Q1 to Q3 C F D1 Q2 Q3 Price P0 A P1 B D0 Q0 Q1 Quantity
A market in disequilibrium Suppose a disastrous harvest moves the supply curve to SS government may try to protect the poor, setting a price ceiling at P1 which is below P0, the equilibrium price level The result is excess demand excess demand S Price D P2 E P0 A B P1 D S RATIONING is needed to cope with the resulting excess demand QS Q0 QD Quantity
What, how and for whom The market: decides how much of a good should be produced by finding the price at which the quantity demanded equals the quantity supplied tells us for whom the goods are produced those consumers willing to pay the equilibrium price determines what goods are being produced there may be goods for which no consumer is prepared to pay a price at which firms would be willing to supply