Download
1 / 12
120 likes | 146 Views
Learn how to construct a confidence interval for the mean of a small sample using the Student's t distribution.

E N D
What if it is impossible or impractical to use a large sample? Apply the Student’s t distribution.
The shape of the t distribution depends only only the sample size, n, if the basic variable x has a normal distribution. When using the t distribution, we will assume that the x distribution is normal.
Table 6 in Appendix II gives values of the variable t corresponding to the number of degrees of freedom (d.f.)
Degrees of Freedom d.f. = n – 1 where n = sample size
The t Distribution has a Shape Similar to that of the the Normal Distribution A Normal distribution A “t” distribution
d.f.=7 Find the critical value tc for a 95% confidence interval if n = 8.
Confidence Interval for the Mean of Small Samples (n < 30) from Normal Populations • c = confidence level (0 < c < 1) • tc = critical value for confidence level c, and degrees of freedom = n - 1
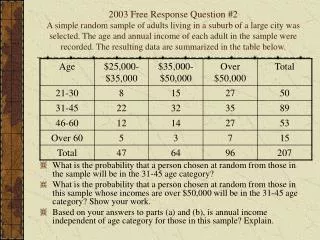
The mean weight of eight fish caught in a local lake is 15.7 ounces with a standard deviation of 2.3 ounces. Construct a 90% confidence interval for the mean weight of the population of fish in the lake.
Mean = 15.7 ounces Standard deviation = 2.3 ounces. • n = 8, so d.f. = n – 1 = 7 • For c = 0.90, Table 6 in Appendix II gives t0.90 = 1.895.
Mean = 15.7 ounces Standard deviation = 2.3 ounces. • E = 1.54 • The 90% confidence interval is: • 15.7 - 1.54 < < 15.7 + 1.54 • 14.16 < < 17.24
The 90% Confidence Interval:14.16 < < 17.24 We are 90% sure that the true mean weight of the fish in the lake is between 14.16 and 17.24 ounces.