Download

1 / 19
190 likes | 349 Views
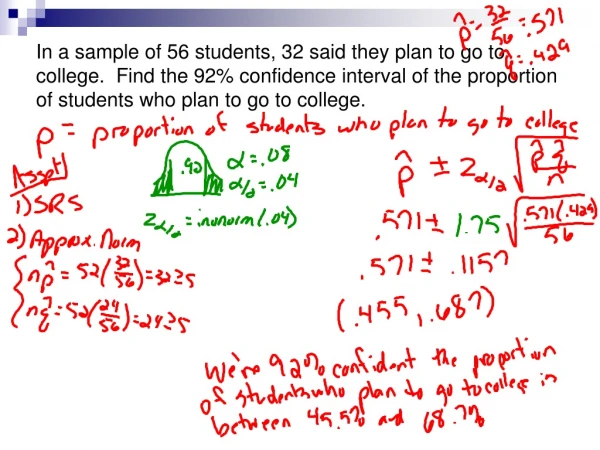
This guide outlines the essential conditions for constructing valid large-sample confidence intervals for a population mean (µ), focusing on sample size and the Central Limit Theorem. It covers calculations for 90% confidence intervals based on different sample sizes, discusses the implications of sample size on interval width, and contrasts approaches to small samples using t-statistics when the population standard deviation is unknown. The guide also explains the practical application through a case study involving car mileage statistics and confidence interval interpretation.

E N D
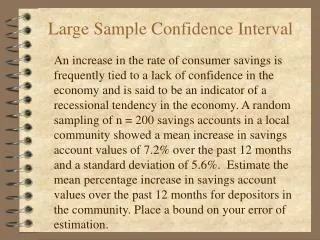
Conditions Required for a Valid Large-SampleConfidence Interval for µ 1. A random sample is selected from the target population. 2. The sample size n is large (i.e., n ≥ 30). Due to the Central Limit Theorem, this condition guarantees that the sampling distribution of is approximately normal. Also, for large n, s will be a good estimator of .
Thinking Challenge • Wehave a randomsample of customerordertotalswith an average of $78.25 and a populationstandarddeviation of $22.5. • A) Calculate a 90% confidenceintervalforthemeangiven a sample size of 40 orders. • B) Calculate a 90% confidenceintervalforthemeangiven a sample size of 75 orders. • C) Explainthedifference in the 90% confidenceintervalscalculated in A and B. • D)Calculate the minimum sample size needed to identify a 90% confidence interval for the mean assuming a $5 margin of error.
6.3 Confidence Interval for a Population Mean:Student’s t-Statistic
Smallsample size problem forinferenceabout • Theuse of a smallsample in makinginferenceabout presentstwoproblemswhenweattempttousethestandard normal z as a test statistic.
Problem 1 • Theshape of thesamplingdistribution of thesamplemeannowdepends on theshape of thepopulationsampled. • We can no longerassumethatthesamplingdistribution of samplemean is approximately normal becausethecentral limit theoremensuresnormalityonlyforsamplesthataresufficientlylarge.
Solutionto Problem 1 • Weknowthatifoursamplecomesfrom a populationwith normal distributionthesamplingdistribution of samplemeanwill be normal regardless of thesample size.
Problem 2 • Thepopulationstandarddeviation is almostalwaysunknown. Forsmallsamplesthesamplestandarddeviaitonsprovidespoorapproximationfor .
Solutionto Problem 2(Small Sample with known) Use the standard normal statistic
Solutionto Problem 2(Small Sample with Unknown) Instead of using the standard normal statistic use the t–statistic in which the sample standard deviation, s, replaces the population standard deviation, .
Student’s t-Statistic The t-statistic has a sampling distribution very much like that of the z-statistic: mound-shaped, symmetric, with mean 0. The primary difference between the sampling distributions of t and z is that the t-statistic is more variable than the z-statistic.
Degrees of Freedom The actual amount of variability in the sampling distribution of t depends on the sample size n. A convenient way of expressing this dependence is to say that the t-statistic has (n – 1) degrees of freedom(df).
Student’s t Distribution Standard Normal Bell-Shaped Symmetric ‘Fatter’ Tails t (df = 13) t (df = 5) z t 0 Thesmallerthedegrees of freedomfor t-statistic, themorevariablewill be itssamplingdistribution.
Wehave a randomsample of 15 cars of thesame model. Assumethatthegasmilageforthepopulation is normallydistributedwith a standarddeviaition of 5.2 milesper galon. • A) Identifytheboundsfor a 90% confidenceintervalforthemeangiven a samplemean of 22.8 milespergallon. • B) The car manufacturer of thisparticular model claimsthattheaveragegasmilage is 26 milespergallon. Discussthevalidity of thisclaimusingthe 90% confidenceintervalcalculated in A. • C) Let a and b representthelowerandupperboundaries of 90% confidenceintervlforthemean of thepopulation. Is it correcttoconcludethat tere is a 90% probabilitythattruepopulationmeanliesbetween a and b?
Thinking Challenge • In 1882 Michelsonmeasuredthespeed of light. His values in km/secand 299,000 substractedfromthem. He reportedtheresults of 23 trialswith a mean of 756.22 and a standarddeviaition of 107.12. • Find a 95% confidenceintervalforthetruespped of lightfromthesestatistics. • Interpretyourresult.