Understanding Samples, Populations, and Data Classification in Statistics
260 likes | 403 Views
This document explores the fundamental concepts of statistical samples and populations, highlighting their differences and applications. It delves into the practicality of obtaining population data and the significance of samples in statistics. Additionally, it covers data classification, distinguishing between qualitative and quantitative data, and discusses the four levels of measurement: nominal, ordinal, interval, and ratio. Examples are provided to illustrate these concepts and assist students in their statistical homework assignments.

Understanding Samples, Populations, and Data Classification in Statistics
E N D
Presentation Transcript
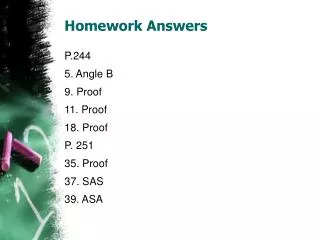
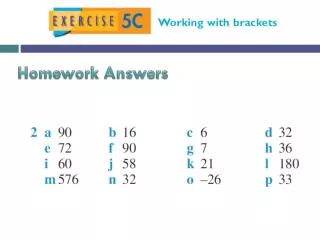
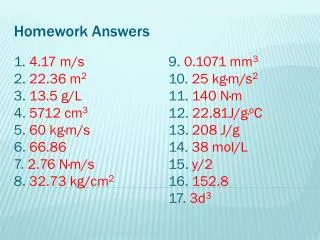
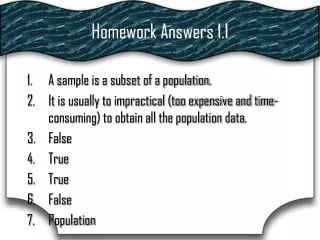
Homework Answers 1.1 • A sample is a subset of a population. • It is usually to impractical (too expensive and time-consuming) to obtain all the population data. • False • True • True • False • Population
Homework Answers 1.1 8. Sample 9. Sample 10. Population 11. Population: Party of registered voters in Bucks County. Sample: Party of Bucks County voters responding to a phone survey. 12. Population: Major of college students at Central College. Sample: Major of college students at Central College who take Statistics.
Homework Answers 1.1 13. Population: Ages of adult Americans who own computers. Sample: Ages of adult Americans who own Dell computers. 14. Population: Income of all home owners in Ohio. Sample: Income of home owners in Ohio with mortgages. 15. population: Collection of all infants. Sample: Collection of the 33,043 infants in the study.
Homework Answers 1.1 16. Population: Collection of all American households Sample: Collection of the 1023 American households surveyed. 17. Population: Collection of all American women. Sample: Collections of the 546 American women surveyed. 18. Population: Collection of all American vacationers Sample: Collection of the 872 American vacationers surveyed.
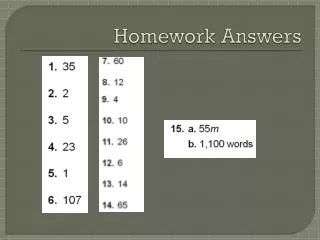
Homework Answers 1.1 19. statistic 20. statistic 21. statistic 22. parameter 23. The statement “56% are the primary investor in their household” is an application of descriptive statistics. An inference drawn from the sample is that an association exists between American women and the primary investor in their household.
Homework Answers 1.1 24. The statement “spending at least $1800 for their next vacation” is an application of descriptive statistics. An inference drawn from the sample is that American vacationers are associated with spending more than $1800 for their next vacation.
1.2 Data Classification Statistics Mrs. Spitz Fall 2008
Objectives • How to distinguish between qualitative data and quantitative data. • How to classify data with respect to the four levels of measurement: nominal, ordinal, interval, and ratio
Assignment • Pgs. 12-13 #1-20 all
Definitions • Qualitative data consist of attributes, labels or non-numerical entries. • Quantitative data consist of numerical measurements or counts.
Ex. 1 Classifying Data by Type • The base price of several vehicles are shown in the table. Which data are qualitative and which are quantitative data? Explain your reasoning.
Ex. 1 Classifying Data by Type • Solution: The information shown in the table can be separated into other data sets. One data set contains the names of the vehicle models and the other contains base prices of vehicle models. The names are non-numerical entries are qualitative data. The base prices are numerical, so these are quantitative data.
Ex. 2 – Try it yourself • The populations of several US cities are shown in the table. Which data are qualitative and which are quantitative? A. ID the contents of the data set. B. Decide whether the data consist of numerical or non-numerical entries. C. Specify the qualitative or quantitative data.
A. City population B. City – non-numerical Population: Numerical C. City: Qualitative Population: Quantitative The populations of several US cities are shown in the table. Which data are qualitative and which are quantitative? A. ID the contents of the data set. B. Decide whether the data consist of numerical or non-numerical entries. C. Specify the qualitative or quantitative data. Ex. 2 – Try it yourself
Levels of Measurement • Another data characteristic is the data’s level of measurement. The level of measurement determines which statistical calculations are meaningful. The four levels of measurement, in order from lowest to highest are nominal, ordinal, interval and ratio. • When numbers are at the nominal level of measurement, the simply represent a label. Examples of numbers used as labels include social security numbers, and numbers on sports jerseys.
Definitions • Nominal Level – Data in the nominal level of measurement are qualitative only. Data at this level are categorized using names, labels, or qualities. No mathematical computations can be made at this level. • Ordinal Level – Data at the nominal level of measurement are qualitative or quantitative. Data at this level can be arranged in order, but differences between data entries are not meaningful.
Ex. 3 Classifying data by level • Two sets of data are shown. Which data set consists of data at the nominal level? Which data set consists of data at the ordinal level? Explain your reasoning.
Ex. 3 Classifying data by level • The first data set lists the rank of five TV programs. The data consists of the ranks, 1, 2 ,3 ,4 and 5. Because the rankings can be listed in order, these data are at the ordinal level. Note the difference between a rank of 1 and 5 has no mathematical meaning.
Ex. 3 Classifying data by level • The second set of data consists of the call letters of each network affiliate in Portland. The call letters are simply the names of network affiliates, so these data are at the nominal level.
Definitions • Interval Level – Data at the interval level are quantitative. The data can be ordered and you can calculate meaningful differences between data entries. At the interval level, a zero entry is simply representing a position on a scale; the entry in not an inherent zero.
Definitions • Ratio Level – Data at the ratio level are similar to data at the interval level with the added property that a zero entry IS AN INHERENT ZERO. A ratio of two data values can be formed so one data value can be expressed as a multiple of another.
Note: • An inherent zero is a zero that implies “none.” For instance, the amount of money you have in a savings account could be zero dollars. In this case, the zero represents no money—it is an inherent zero. On the other hand, a temperature of 0° does NOT REPRESENT a condition where no heat is present. The 0°C temperature is simply a position on the Celsius scale. It is NOT and inherent zero.
Ex. 4: Classifying data by level • Two data sets are shown. Which data set consists of data at the interval level? Which data set consists or data at the ratio level? Explain your reasoning.
Ex. 4: Classifying data by level • Both contain quantitative data. Consider the dates of the Yankees’ World Series victories. It makes sense to find the difference between specific dates. For instance, the time between the Yankees’ first and last World Series victories is 1998 – 1923 = 75 years – • But it does NOT make sense to write a ratio using these dates. So, these data are at the interval level.
Other Data Set Using the home run totals, you can find differences and write ratios. From the data, you can see that New York hit three more homeruns than Kansas City hit and that Seattle hit twice as many homeruns Minnesota hit. So these data are compared at the ratio level.
The following tables summarize meaningful operations at the four levels of measurement.