Download
1 / 85
850 likes | 1.03k Views
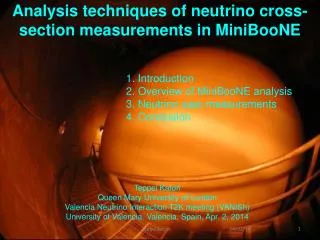
Analysis techniques of neutrino cross-section measurements in MiniBooNE. 1. Introduction 2. Overview of MiniBooNE analysis 3. Neutrino xsec measurements 4. Conclusion. Teppei Katori Queen Mary University of London Valencia Neutrino Interaction T2K meeting ( V ANISh )

E N D
Analysis techniques of neutrino cross-section measurements in MiniBooNE 1. Introduction 2. Overview of MiniBooNE analysis 3. Neutrino xsec measurements 4. Conclusion Teppei Katori Queen Mary University of London Valencia Neutrino Interaction T2K meeting (VANISh) University of Valencia, Valencia, Spain, Apr. 2, 2014 Teppei Katori
1. Introduction 2. Overview of MiniBooNE analysis 3. Neutrino cross section measurements 4. Conclusion Teppei Katori
1. Introduction PPD neutrino talk (2010), http://minerva-docdb.fnal.gov/cgi-bin/ShowDocument?docid=5571 Purpose of this talk - This talk is prepared for students who want to measure neutrino cross-sections for their PhD theses. - It is especially focusing on absolute flux-integrated topological differential cross section measurement [1]. The most important model-independent result to provide to the community. absolute: normalization is specified flux-integrated: neutrino flux shape is not unfolded topological: interaction is defined from final state particles differential: cross section is function of measured kinematic variables - MiniBooNE developed number of techniques necessary to measure these, and this talk covers technical aspects from the CCQE, NCEL, NC1po, CC1p+, CC1po, antiCCQE, antiNCEL. These are good reference but not the best, T2K should perform even better analyses! [1]Can anybody invent a better name for this? Teppei Katori
1. Introduction Goal of neutrino cross section measurement - Goal is to measure model-independent cross section as much as possible. This is what theorists want to study their models. Model-independent cross-section is - absolute (flux is not tuned from own measurement) - the dependence of signal channel MC is minimum - detector efficiency must be corrected (so it is detector model-dependent) - no assumption on kinematics (cf neutrino energy reconstruction with lepton kinematics assume CCQE interaction and neutron at rest), which often means cross-section is function of measured variables (differential cross-section) Formula of flux-integrated differential cross-section Teppei Katori
1. Introduction 2. Overview of MiniBooNE analysis 3. Neutrino cross section measurements 4. Conclusion Teppei Katori
2. Overview of MiniBooNExs measurements CCQE (CC0p) PRD81(2010)092005 FERIMILAB-THESIS-2008-64 Signal definition: 1 m + 0 p + N protons Why we measure - Test CCQE models Why MiniBooNE measure - Largest sample (~40%) to test detector efficiency, veto efficiency, event uniformity, timing, etc - Best sample to study neCCQE kinematics (=oscillation signal) - nmCCQE to constraint ne from m-decay in oscillation sample It is important to measure CCQE! CCQE Teppei Katori
2. Overview of MiniBooNExs measurements by Denis Perevalov NCEL PRD82(2011)092005 FERIMILAB-THESIS-2009-47 Signal definition: 0 m + 0 p + N protons Why we measure - Additional test of CCQE models - Measurement of Ds - value is still controversial - connection of form factor (elastic) and PDF (inelastic) Why MiniBooNE measure - NCEL to constrain oil optical property oil optical property is the largest detector systematics. NCEL was used to assign variation. It is important to measure NCEL! MiniBooNE collaboration, PRD82(2011)092005 NCEL CCQE Teppei Katori
2. Overview of MiniBooNExs measurements by Colin Anderson NC1po PRD81(2010)013005 FERIMILAB-THESIS-2010-49 Signal definition: 0 m + 1 po + N protons Why we measure - The biggest misID background for ne appearance experiments all oscillation experiments perform internal measurement to constrain Why MiniBooNE measure - po mass peak for energy calibration - measured po kinematics is used to correct simulation It is important to measure NC1po! MiniBooNE collaboration, PRD81(2010)013005 NCEL CCQE NC1po Teppei Katori
2. Overview of MiniBooNExs measurements by Mike Wilking CC1p+ PRD83(2011)052007 FERIMILAB-THESIS-2009-27 Signal definition: 1m + 1 p+ + N protons Why we measure - The biggest misID background for nm disappearance experiments - kinematic distortion by this background must be understood Why MiniBooNE measure - highest purity channel (~90%) Michel electron tagging achieve extremely pure sample - Constrain wrong sign background in anti-neutrino mode CC1p+ in anti-n mode is definitely from n-contamination It is important to measure CC1p+! MiniBooNE collaboration, PRD83(2011)052007 NCEL CCQE CC1p+ NC1po Teppei Katori
2. Overview of MiniBooNExs measurements by Bob Nelson CC1po PRD83(2011)052009 FERIMILAB-THESIS-2010-9 Signal definition: 1m + 1 po + N protons Why we measure - There is no coherent channel, so it is useful to understand coherent/resonance D production Why MiniBooNE measure - The last possibly measurable channels, by this, MiniBooNE measure 90% of interaction cross sections in n-mode It is important to measure CC1po! MiniBooNE collaboration, PRD83(2011)052009 NCEL CC1po CCQE CC1p+ NC1po Teppei Katori
2. Overview of MiniBooNExs measurements by Joe Grange anti-CCQE PRD88(2013)032001 FERIMILAB-THESIS-2013-14 Signal definition: 1m + 0p + N protons Why we measure - Additional test of CCQE models - necessary measurement for CPV measurement Why MiniBooNE measure - To understand anti-neCCQE interaction kinematics (oscillation signal) - anti-nmCCQE constraint for anti-ne from m-decay - Tune wrong sign components in anti-n mode beam It is important to measure antiCCQE! MiniBooNE collaboration, PRD88(2013)032001 anti CCQE NCEL CC1po CCQE CC1p+ NC1po Teppei Katori
2. Overview of MiniBooNExs measurements by RanjanDharmapalan anti-NCEL arXiv:1309.7257 FERIMILAB-THESIS-2012-29 Signal definition: 0m + 0p + N protons Why we measure - Complete all 4 QE measurements (CCQE, NCEL, antiCCQE, antiNCEL) Why MiniBooNE measure - test beam-dump mode run (dark matter search) anti-n mode beam was used to test MiniBooNE dark matter sensitivity. antiNCEL was the biggest background. It is important to measure antiNCEL! MiniBooNE collaboration, arXiv:1309.7257 anti NCEL anti CCQE NCEL CC1po CCQE CC1p+ NC1po Teppei Katori
2. Overview of MiniBooNExs measurements To be published - CC inclusive cross section - 1 m + 0 p +1 proton (2 track CCQE) Possibly measured in T2K, but not in MiniBooNE NC1p+ (0 m + 1 p+ + N protons) - another resonance only channel 1 m + 1 p+ + 1 proton - 3 track CC1p+, high pure D++ measurement 1 m + 0 p + 2 protons - high pure MEC? anti NCEL anti CCQE NCEL CC1po CCQE CC1p+ NC1po Teppei Katori
1. Introduction 2. Overview of MiniBooNE analysis 3. Neutrino cross section measurements 4. Conclusion Teppei Katori
3. Neutrino cross-section measurements Absolute flux-integrated topological differential cross section formula Uij :unsmearing matrix i :true index j : reconstructed index 3.1 Signal definition 3.2 Background removing 3.3 Unsmearing 3.4 Efficiency correction 3.5 Flux correction 3.6 Target number correction 3.7 Binning 3.8 Systematic errors 3.9 Data format bj :predicted background dj :data vector Dxi :bin width ei :efficiency T :integrated target number F :integrated n-flux Teppei Katori
3.1 Signal definition 3.2 Background removing 3.3 Unsmearing 3.4 Efficiency correction 3.5 Flux correction 3.6 Target number 3.7 Binning 3.8 Systematic errors 3.9 Data format Uij :unsmearing matrix bj :predicted background dj :data vector Dxi :bin width ei :efficiency T :integrated target number F :integrated n-flux Teppei Katori
3.0 Before you start cross section analysis... Reconstructions and cuts - You have good reconstruction and all cuts to select your data sample, congratulations, you are ready to measure cross sections! (you can spend another year in grad school from there!) Teppei Katori
3.0 Event selection Reconstructions and cuts - You have good reconstruction and all cuts to select your data sample, congratulations, you are ready to measure cross sections! (you can spend another year in grad school from there!) Good sample - depends - reasonable statistics to make few bins - measure distributions as many as possible - Purity ~ 50% or more (improving purity improving systematics) Before you start systematics analysis, you should know rough total final error. - lose/tight cuts - change bin size - sideband constraint - which differential cross section to measure Teppei Katori
3.0 Event selection Reconstructions and cuts - You have good reconstruction and all cuts to select your data sample, congratulations, you are ready to measure cross sections! (you can spend another year in grad school from there!) Good sample - depends - reasonable statistics to make few bins - measure distributions as many as possible - Purity ~ 50% or more (improving purity improving systematics) Before you start systematics analysis, you should know rough total final error. - lose/tight cuts - change bin size - sideband constraint - which differential cross section to measure We don’t expect more statistics in near future, and most of analyses will be ~ 10-20% error. Any cross section data from T2K are unique and precious. WE SHOULD PUBLISH ASAP! Teppei Katori
3.1 Signal definition Topological cross section ex) CC1po = “ 1m + 1 po + N protons” i. This definition includes po production by final state interactions (FSIs). ii. This definition excludes CC1pointeraction when po is lost by FSIs. This is the necessary definition for the theorists to understand final state interactions (FSIs) without biases. Don’t rely on the definition given by your interaction generator. “Signal” needs to be added to signal MC, and “Not signal” needs to be removed from signal MC. By this definition, FSI error of pion shouldn’t be big,but detector pion absorption is part of final error. CC1po m m m m p p p p p Signal Not signal Signal n n n n p Signal absorption in nuclei p p too low energy to detect p production Teppei Katori
3.1 Signal definition T2K, ArXiv:1403.3140 NCQE gamma measurement - signal is defined to be gamma from NCQE interactions. - gamma ray from FSI is not signal. Alternatively, any gammas from any NC interaction can be defined “signal” (topological cross section), in this way, most of FSI error is gone (smaller systematics), signal statistics is higher, and data is less biased. Drawback is now theorist need to calculate FSI by themselves. Teppei Katori
3.1 Signal definition Topological signal definition 1. Statistics is higher You have more signal, so statistics is higher 2. Systematic error is lower Nuclear effect is now signal, not error. Likewise, signal channel model error should be large. 3. Less biased There is no cross-section model dependent selection nor correction. Data is less biased and preferred by theorists. Theorists want to find how much MEC from our data using their state-of-the-art nuclear models. We are responsible to provide unbiased data containing these information. If we use MEC model in our simulation for the selection of events, this mean we try to find how much MEC in our data based on our knowledge. This has 2 bad consequences, 1. theorists lose jobs 2. result is wrong Teppei Katori
3.1 Signal definition T2K, ArXiv:1403.3140 NCQE gamma measurement - signal is defined to be gamma from NCQE interactions. - gamma ray from FSI is not signal. Alternatively, anay gamma from NC interaction can be defined “signal” (topological cross section), in this way, most of FSI error is gone (smaller systematics), signal statistics is higher, and data is less biased. Drawback is now theorist need to calculate FSI by themselves. Teppei Katori
3.1 Signal definition T2K, TN147 Tracker CCQE analysis - signal is defined from NEUT channel number. Alternatively, signal can be defined “1 muon-like track”. You can measure total cross section by this way, too. Error should be smaller because any processes making “1 muon-like track” becomes signal. Total cross section has reconstruction bias so it’s still harder for theorists to get info of MEC from this shape of this. Teppei Katori
3.1 Signal definition CCQE Primary channel cross section By subtracting CC1p+ without pion background distribution (from MC with sideband correction), “pure” CCQE cross section is published (which is not, due to 2p-2h). Pure channel cross section is helpful for some theorists who cannot simulate whole set of cross sections. Teppei Katori
3.1 Signal definition CC1p+/CCQE Primary channel cross section Pure channel cross section is also useful to compare with otherdata (especially most of old dataare published in pure channel cross section). CC1p+/CCQE topological cross section ratio CC1p+/CCQE primary chnnelcross section ratio Teppei Katori
3.1 Signal definition NCEL Mixed target Cross section result from mixed target is complicated. In NCEL, differential cross section is interpreted n+N, which means sum of n+p (carbon), n+p (hydrogen), and n+n (carbon). Forward folding Migration matrices (Tptrue and Tprecon) are provided for n+p (carbon), n+p (hydrogen), and n+n (carbon), with and without FSI, so that theorists can fold their xsec models to compare with measured Tp. Teppei Katori
3.1 Signal definition NCEL Mixed target Cross section result from mixed target is complicated. In NCEL, differential cross section is interpreted n+N, which means sum of n+p (carbon), n+p (hydrogen), and n+n (carbon). Efficiency difference The efficiency difference of each interaction is provided to reproduce differential cross section from microscopic modes. Teppei Katori
3.1 Measured variables Function of measured variables Differential cross section results with function of measured variables (momentum, direction, etc) has no reconstruction bias and preferred. Function of reconstructed variables Cross section results of reconstructed variables (especially Q2 and En) are model-dependent. However, flux-unfolded total cross section function (function of true neutrino energy) is the only way to compare results with other experiments. CCQE anti NCEL anti CCQE NCEL CC1po CCQE CC1p+ NC1po Teppei Katori
3.1 Signal definition 3.2 Background removing 3.3 Unsmearing 3.4 Efficiency correction 3.5 Flux correction 3.6 Target number 3.7 Binning 3.8 Systematic errors 3.9 Data format Uij :unsmearing matrix bj :predicted background dj :data vector Dxi :bin width ei :efficiency T :integrated target number F :integrated n-flux Teppei Katori
3.2 Background removing Background subtraction method - It is preferred because signal doesn’t depend on signal MC explicitly. - Normalization of background must be known. Purity correction method - Signal explicitly depends on signal MC (=bad), potentially shape is distorted by signal to be measured (depending on size of error). - However, if you don’t know the normalization of background, this may be justified? Background subtraction Purity correction For high purity CCQE sample (77%), difference is only large at lowQ2, where background is ~30% CCQE Background subtraction vs Purity correction Bkgd subtract Signal frac anti NCEL anti CCQE NCEL CC1po CCQE CC1p+ NC1po Teppei Katori
3.2 Background removing Background subtraction method - It is preferred because signal doesn’t depend on signal MC explicitly. - Normalization of background must be known. Purity correction method - Signal explicitly depends on signal MC (=bad), potentially shape is distorted by signal to be measured (depending on size of error). - However, if you don’t know the normalization of background, this may be justified? Hybrid - External background (=cosmic rays) are measured from sideband (=known normalization), and subtracted. - Internal background (=NC1p+ where pion is below detection threshold) is removed by purity correction. Background subtraction Purity correction anti NCEL anti NCEL anti CCQE NCEL Internal background (no constraint) NCEL CC1po CCQE CC1p+ NC1po External background (measured) Teppei Katori
3.2 Background removing Data driven correction - Almost all analyses use sideband data to correct background distribution in signal boxes External background measurement - NCEL analysis measure amount of background coming from outside, with function of R and Z, to extrapolate background in fiducial volume NCEL External background enhanced sample NCEL anti NCEL anti CCQE NCEL CC1po CCQE CC1p+ Teppei Katori
3.2 Background removing Data driven correction - Almost all analyses use sideband data to correct background distribution in signal boxes Flux error double counting? - For background dominant sample, background subtraction makes flux error larger. - Way to avoid is to define background excursion after removing normalization correlated with signal (shape-only background subtraction) anti NCEL anti CCQE NCEL CC1po CCQE CC1p+ Teppei Katori
3.2 Background removing Data driven correction - Almost all analyses use sideband data to correct background distribution in signal boxes Cross section error - Main xsec error is the error assigned on background models - Xsec models, such as FSIs?, change true-recon relationship for hadrons (smearing) - Xsec models kinematics, i.e., cuts (=efficiency) anti NCEL anti CCQE NCEL CC1po CCQE CC1p+ Teppei Katori
3.1 Signal definition 3.2 Background removing 3.3 Unsmearing 3.4 Efficiency correction 3.5 Flux correction 3.6 Target number 3.7 Binning 3.8 Systematic errors 3.9 Data format Uij :unsmearing matrix bj :predicted background dj :data vector Dxi :bin width ei :efficiency T :integrated target number F :integrated n-flux Teppei Katori
3.3 Unsmearing Unfolding - The process removing the detector effects, mainly smearing and detector cut, is called unfolding. It is often easier to think by separating unfolding process to 2 parts, unsmearing and efficiency correction. We focus on unsmearing here. Detector error - Detector model affect smearing. Teppei Katori
3.3 Unsmearing None Inverse response matrix method - Inverse response matrix method is the bias-free unfolding method, but this method doesn’t work for anybody. Typically, it makes rapid oscillated solution (Gibb’s phenomenon). Say, response matrix R gives the smearing and detector cut of true distribution a to measured distribution b in MC, it’s inverse can be used to unfold data b to true distribution a Inverse response matrix method is very sensitive with MC statistics. It doesn’t work for sparse matrix, it cannot handle large number of bins, it cannot deal histogram with zero-event bins. But all these are features for differential cross section! CCQE fake data Bayesian unsmearing (next) Inverse response matrix method Teppei Katori
3.3 Unsmearing Höcker, Kartvelishvili NIM.A372(1996)469 NC1po Tikhonovregularization method - The regularization term from the prior knowledge of distribution (e.g., how smooth is) can stabilize inverse response matrix. The bias is introduced through the linear operator L and t. Regularization parameter tshould be chosen with care. - too small t doesn’t regulate matrix inversion - too large t too much smooth out response matrix R Solution is, Teppei Katori
3.3 Unsmearing D’Agostini, NIM.A362(1995)487 Iterative Bayesian method - Unsmearing is based on the Bayesian statistics, so bias is introduced from MC knowledge - Efficiency e is defined by true distribution after cut m to true distribution before cut a. M-matrix gives transformation from measured distribution to true distribution after cut. It give the true distribution after cut m on projection on one axis. Now, define U-matrix by normalizing M-matrix with other axis, So, background subtracted data d0th can be unsmeared and efficiency corrected to obtain unfolded cross section d1th anti NCEL anti CCQE NCEL CC1po CCQE CC1p+ NC1po Teppei Katori
3.3 Unsmearing D’Agostini, NIM.A362(1995)487 Iterative Bayesian method - Unsmearing is based on the Bayesian statistics, so bias is introduced from MC knowledge - It is based on Bayes’ theorem anti NCEL anti CCQE NCEL CC1po CCQE CC1p+ NC1po Teppei Katori
3.3 Unsmearing D’Agostini, NIM.A362(1995)487 Iterative Bayesian method - Unsmearing is based on the Bayesian statistics, so bias is introduced from MC knowledge If initial guess m (=prior probability of Bayesian statistics) is not so close to nature, we can improve U-matrix by assuming d1th is close to nature - This iteration process usually converge <5 times. 0th iteration is not bad at all. - Signal model dependence will become systematic error, this is done by varying M-matrix by changing systematics. So signal cross error is part of final error, but shape only. - This method also fails if M-matrix is highly non-diagonal. - 0th and 1st iteration difference of data is also included as systematic error (?). Iterative Bayesian method works for, any number of bins, including zeros, sparse matrix, MxN matrix, background non-subtracted sample etc... anti NCEL anti CCQE NCEL CC1po CCQE CC1p+ NC1po Teppei Katori
3.3 Unsmearing D’Agostini, NIM.A362(1995)487 NC1po CC1p+ CC1po How to construct M-matrix? Measured variables - It is desired to present differential cross section with function of measured quantities, such as muon energy, pion angle, etc, because they are not biased by reconstruction. i. It is straightforward if you measure lepton kinematics. True leptonkinematics arethe true information for M-matrix. ii. If you measure hadronicevents (e.g., po momentum), your “true” kinematics is after FSI, i.e., particle exiting the nuclei. anti CCQE CCQE p p p not true pion momentum anti NCEL not true nucleon momentum n NCEL true pion momentum n iii.“true” momentum is defined by sum of all outgoing nucleons, because that is the observables. p rescattering all kind of FSI p true nucleon momentum n n p Teppei Katori
3.3 Unsmearing CC1p+ CC1po How to construct M-matrix? Reconstructed variables - The definition of true kinematics is tricky, because you have choices. i. True Q2 is defined by reconstructed Q2 from true kinematics For example, CCQE, true Q2 is defined “reconstructed Q2 from true muon energy and angle”, and we call it “Q2QE” to remind people this is reconstructed under QE assumption. ii True Q2 is defined by true Q2 in MC This may be useful to compare with old data, only presented by this way iii True En is defined by true En in MC For example, CCQE, En is called “EnQE,RFG” to remind people this is reconstructed under QE assumption then unfolded by assuming RFG model. anti CCQE anti NCEL NCEL CCQE anti CCQE CC1po CCQE CC1p+ NC1po Teppei Katori
3.3 Unsmearing NC1po No unsmearing - If you know smearing is weak and statistics is low, no unsmearing may be the best option. So what is the criteria? Teppei Katori
3.3 Unsmearing Cowan, “Statistical Data Analysis” NC1po No unsmearing - If you know smearing is weak and statistics is low, no unsmearing may be the best option. So what is the criteria? Bias of unsmearing - There is no perfect unfolding, unfolding method can be different depending on your distribution. Biases may be one of criteria. i. Inverse response matrix method: No bias, but it only works for very few bin histogram ii. Tikhonov regularization Bias is introduced from linear function and regularization parameter. It also requires a fair amount of events. iii. Iterative Bayesian method Bias is introduced from prior knowledge of MC. It works for any distribution. iv. No unsmearing Teppei Katori
3.3 Unsmearing NC1po po kinematics - Comparing biases and histograms by eyes, po-kinematics are unfolded by 3 different methods. Pp(n) : Tikhonov regularization cosqp(n) : Iterative Bayesian Pp(anti-n) : Iterative Bayesian cosqp(anti-n) : No unsmearing No unsmear inversion Bayesian Tikhonov reg. No unsmear inversion Bayesian Tikhonov reg. Teppei Katori
3.1 Signal definition 3.2 Background removing 3.3 Unsmearing 3.4 Efficiency correction 3.5 Flux correction 3.6 Target number 3.7 Binning 3.8 Systematic errors 3.9 Data format Uij :unsmearing matrix bj :predicted background dj :data vector Dxi :bin width ei :efficiency T :integrated target number F :integrated n-flux Teppei Katori
3.4 Efficiency correction Looks straightforward, no? - The efficiency is defined as true distribution after cut m divided by that before cut a. Because of the nature of ratio, e is insensitive with many systematic variations common for numerator and denominator such as flux error and cross section error. The detector error is important. anti NCEL anti CCQE NCEL CC1po CCQE CC1p+ NC1po Teppei Katori
3.4 Efficiency correction CCQE Muon energy unfolding - Because of the resolution of muon energy, it is possible to recover events outside of kinematic cut by unfolding process (detector model dependent) Teppei Katori