Download
1 / 52
540 likes | 781 Views
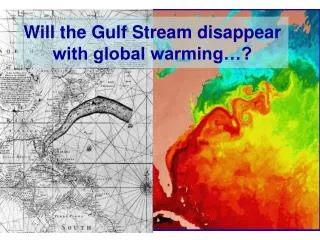
Will the Gulf Stream disappear with global warming…?. Strength of ocean overturning at 30N (A1B Scenario + constant after yr2100). Our own EPcm. Control experiment. After a sudden 2XCO2. Strength of ocean overturning at 30N (A1B Scenario + constant after yr2100).

E N D
Strength of ocean overturning at 30N (A1B Scenario + constant after yr2100)
Our own EPcm Control experiment After a sudden 2XCO2
Strength of ocean overturning at 30N (A1B Scenario + constant after yr2100) What is the ocean doing...??
Outline • Background on the thermohaline circulation and the Gulf Stream • Why is there such a large spread among climate models when it comes to the Gulf Stream? • Will the Gulf Stream disappear with global warming?
Part 1: Background on the Gulf Stream and the thermohaline circulation
Broecker, 2005 NB: 1 Amazon River ≈ 0.2 Million m3/s
The Gulf Stream refers to the North Atlantic portion of this global “thermohaline circulation” Broecker, 2005 NB: 1 Amazon River ≈ 0.2 Million m3/s
Captain Ellis and the Earl of Halifax “measurements” (1751) • “Upon the passage, I made several trials with the bucket sea-gage. I charged it and let it down to different depths, from 360 feet to 5346 feet; when I discovered, by a small thermometer of Fahrenheit’s, made by Mr. Bird, which went down to it, that the cold increased regularly, in proportion to the depths, till it descended to 3900 feet: from whence the mercury in the thermometer came up to 53 degrees; and tho’ I afterwards sunk it to the depth of 5346 feet, it came up no lower. The warmth of the water upon the surface, and that of the air, was at the time by the thermometer 84 degrees.”
Captain Ellis and the Earl of Halifax “measurements” (1751) • “The experiment, which seem’d at first but mere food for curiosity, became in the interim very useful to us. By its means we supplied our cold bath, and cooled our wines or water at pleasure; which is vastly agreeable to us in this burning climate” NB: Captain Ellis was at 25N, 25W
Count Rumford explains the measurements… But a still more striking, and I might, I believe, say, an incontrovertible proof of the existence of currents of cold water at the bottom of the Sea, setting from the poles towards the equator, is the very remarkable difference that has been found to subsist between the temperature of the sea at the surface and at great depth, at the tropic –though the temperature of the atmosphere there is so constant that the greatest changes produced in it by the seasons seldom amounts to more than five or six degrees; yet the difference between the heat of water at the surface of the Sea, and that at the depth of 3600 feet, has been found to amount to no less than 31 degrees; the temperature above or at the surface being 84 degrees, and at the given depth below no more than 53 degrees. It appears to me to be extremely difficult, if not quite impossible, to account for this degree of cold at the bottom of the sea in the torrid zone, on any other supposition than that of cold currents from the poles. born Benjamin Thompson (1753-1814)
Theory of the thermohaline circulation also led to observational discoveries
The Stommel-Aarons-Faller experiments (1958) Ω Surface cooling WARM So So COLD Water Volume of cold layer increases at the expense of the volume of warm water
Results “North” So A “western boundary current” is produced, flowing towards the “South” (equator)! “East” “West” “South”
Results “North” So A “western boundary current” is produced, flowing towards the “South” (equator)! “East” “West” This deep current was observed in the North Atlantic in 1960 “South”
More recent measurements of Deep Western Boundary currents in the North Atlantic Subtropical gyre current (northward) Deep western Boundary current (southward) Meinen et al. (2004)
“Observations” of the Gulf Stream and the thermohaline circulation
No such observations can exist… • Impossible to have current meters everywhere in the ocean at any time! • So one needs to be smart and interpolate the available data in the best possible way… • To do this the solution is to constrain a numerical ocean model to be close to observations
Why is sea surface height useful? … Newton’s law! CORIOLIS FORCE = PRESSURE FORCE Sea surface height Current
10-yr average sea surface height(deviation from geoid) GULF STREAM
GULF STREAM KUROSHIO AGULHAS Malvinas East Australian Current
Atlantic ocean’s meridional overturning streamfunction simulated by MITgcm constrained to satellite altimetry Wunsch (2000)
Part 2: Mechanisms • Why is there so much spread among climate models?
Mechanisms • Why is there so much spread among climate models? → Feedback analysis!
Stommel’s model of the thermohaline circulation (1961) Heating & Salinification (low latitudes) Cooling & Freshening (high latitudes) z “Gulf Stream” “sea surface” (Anticlockwise if box1 is denser) (density increases with S & decreases with T) temperature salinity
Heating and cooling at the sea surface Cooling: Enthalpy flux+surface radiation exceed solar+greenhouse radiation Heating: Solar+greenhouse radiation exceed Enthalpy flux+surface radiation Surface heat flux (Wm-2, color) and temperature (contours, °C) -NOC climatology
Two equilibrium states High latitudes Low latitudes “Thermal”: -Density driven by T -Strong Gulf Stream COLD (fresh) WARM (salty) Ψ Low latitudes High latitudes “Haline”: -Density driven by S -Weak (reverse) Gulf Stream SALTY (warm) FRESH (cold) Ψ
Positive salt feedback High S at high latitudes Enhanced N/S density gradient Enhanced Gulf Stream
Positive salt feedback High S at high latitudes UNSTABILITY, leads to large response to perturbations Enhanced N/S density gradient Enhanced Gulf Stream
Negative temperature feedback Low T at high latitudes High T at high latitudes Reduced N/S density gradient Reduced Gulf Stream (reduced poleward heat transport)
Negative temperature feedback Low T at high latitudes High T at high latitudes STABILITY, leads to small response to perturbations Reduced N/S density gradient Reduced Gulf Stream (reduced poleward heat transport)
Different models have different temperature & salinity feedbacks and this is what leads to the spread in models’ behaviour
Different models have different temperature & salinity feedbacks because these involve coupled ocean-atmosphere processes… • Changes in sea surface temperature induced by changes in ocean circulation alter the atmospheric circulation • This in turn modifies the cooling and freshening of the ocean at the sea surface… • … which changes back the sea surface temperature and salinity!
Inter-model comparison is a very active area of research… Ocean circulation intensity Yin & Stouffer (2007) 100yr 200yr 300yr Strong S feedback because of weak A/O coupling…
Strength of ocean overturning at 30N (A1B Scenario + constant after yr2100)
…pushing the limit:a movie scenario…? Movie Scenario: -CO2 increases -Hydrological cycle strengthens -Atlantic Ocean becomes much less salty -The heat pump structure breaks down: the mechanical energy input by the wind can not be converted to a heat transport -Sea-ice margin moves southward -Sea-ice albedo kicks in… Global Freeze!
The answer is no • As a result of increased CO2, more freshening and more surface heating, which indeed reduces the high latitude density
The answer is no • As a result of increased CO2, more freshening and more surface heating, which indeed reduces the high latitude density • No model predicts an abrupt switch to an “off-state” within the 21st century
The answer is no • As a result of increased CO2, more freshening and more surface heating, which indeed reduces the high latitude density • No model predicts an abrupt switch to an “off-state” within the 21st century • The models which predict a significant weakening are the least reliable (very elementary atmospheric feedbacks, “flux adjusted”)
The answer is no • As a result of increased CO2, more freshening and more surface heating, which indeed reduces the high latitude density • No model predicts an abrupt switch to an “off-state” within the 21st century • The models which, predict a significant weakening are the least reliable (very elementary atmospheric feedbacks, “flux adjusted”) • In general, the more complex the model, the more stable the Gulf Stream