Download
1 / 31
310 likes | 479 Views
Cool-Season High Winds in the Northeast U.S. Jonas V. Asuma , Lance F. Bosart , Daniel Keyser Department of Atmospheric and Environmental Sciences University at Albany/SUNY John S. Quinlan, Thomas A. Wasula , Hugh W. Johnson, Kevin S. Lipton NOAA/NWS, Albany, NY NROW XI Albany, NY

E N D
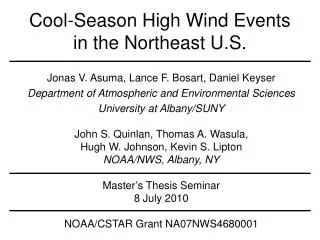
Cool-Season High Winds in the Northeast U.S. Jonas V. Asuma, Lance F. Bosart, Daniel Keyser Department of Atmospheric and Environmental Sciences University at Albany/SUNY John S. Quinlan, Thomas A. Wasula, Hugh W. Johnson, Kevin S. Lipton NOAA/NWS, Albany, NY NROW XI Albany, NY 5 November 2009 NOAA/CSTAR Grant NA07NWS4680001
Overview • Motivation • Cool-season high wind events can be damaging and in some cases challenging to forecast • Structure and environment of such events needs to be rigorously investigated • Objectives • Provide climatological basis for forecasting • Compare large-scale patterns that typify event types • Contrast convective potential of the environment for event types
Outline • Data • Methodology • Results of Climatology • Results of Compositing • Conclusions
Data • Climatology • NCDC Thunderstorm and High Wind reports • Composites • NCEP/NCAR 2.5° Reanalysis data
Methodology (1 of 4) • Climatology • Temporal Domain: 15 Oct 1993 through 31 Dec 2008 • High Wind Definition: Wind measured ≥ 25 m s−1 or damaging winds of any magnitude • Event Definition: Any series of ≥ 2 reports separated by 12 h before and after initial and final report • Events defined by type: • Pure Gradient (PG): No thunderstorm wind reports • Pure Convective (PC): No gradient wind reports • Hybrid (HY): Both thunderstorm and gradient wind reports
Methodology (2 of 4) • Climatology • Spatial Domain: Greater Northeast • 575 total events • 187 HY events • 223 PG events • 165 PC events Reports 0.5° Barnes Analysis of spatial distribution of All wind reports
Methodology (3 of 4) • Composite • Spatial Domain: Northeast (NE) • 358 total events • 158 HY events • 156 PG events • 44 PC events Reports 0.5° Barnes Analysis of spatial distribution of All wind reports
Methodology (4 of 4) • Composite • Composite time (t = 0): Determined to be hour (00, 06, 12, or 18 Z) closest to initial NE report • For reports at 03, 09, 15, or 21 Z earlier hour chosen • Events composited by event type • Created report-relative composites • Grids shifted to location of initial Northeast report • Composites centered on centroid of initial Northeast reports for each event type
Climatology: Monthly Frequency N = 575
Climatology: Annual Frequency N = 575
Climatology: Annual Variability N = 14 years • Events per cool season: • PG: most events • PC: least events • Annual variability: • PG: largest variability • HY: least variability Whiskers encompass inner 90% of data
Climatology: Event Variability N = 575 N = 575 N = 27,644
Summary of Climatology • PC and PG events tied to seasonal cycle of convection • Dynamically vs. thermodynamically driven • HY events have largest impact (more reports per event) • Max in Apr but not uncommon in other months • Likely dynamically AND thermodynamically driven • Interseasonal variability possibly associated with seasonally averaged storm track
Composite Analyses: Surface Pure Gradient N = 156 Hybrid N = 158 L L H H H H Composite initial NE report (star); MSLP(every 2 hPa, black); precipitable water (mm, shaded); 1000-hPa θ(every 4 K, red), total wind (≥10 kt, barbs) N = 44 Pure Convective L H 276 K (mm)
Composite Analyses: 850 hPa Pure Gradient N = 156 Hybrid N = 158 Composite initial NE report (star); 850-hPa Z (every 30 m, black), temperature (every 4°C, dashed); 1000–850-hPa lapse rate (K km−1, shaded), wind shear (≥15 kt, barbs) N = 44 Pure Convective 0°C (K km−1)
Composite Analyses: 500 hPa Pure Gradient N = 156 N = 158 Hybrid Composite initial NE report (star); 500-hPa Z (every 6 dam, black), lifted index (K, shaded); 1000–500-hPa thickness (every 6 dam, red) and wind shear (≥ 40 kts, barbs) N = 44 Pure Convective 540 dam (K)
Composite Analyses: 300 hPa Pure Gradient N = 156 N = 158 Hybrid L J L J Composite initial NE report (star); 300-hPa Z(every 10 dam, black), total wind speed (m s−1, shaded); mslp(every 2 hPa below 1014 hPa only, dashed); jet max (J) and surface low (L) labeled N = 44 Pure Convective J L (m s−1)
Composite Summary • HY and PC cyclones located north of initial report; PG cyclone located east of initial report • PC events tend to be most moist, least stable • PG events tend to be least moist, most stable • HY and PG upper-level wave patterns more amplified compared to PC composite • Suggests stronger dynamical processes • HY report occurs in warm sector in advance of cold front • PG report occurs in region of cold air advection • PC report occurs on warm side of zonally oriented baroclinic zone • Jet structures vary by event type
Conclusions • HY events associated with favorable dynamic AND thermodynamic environments • PG events maximize in Dec: dynamically driven • PC events maximize in Apr: thermodynamically driven • Interseasonal variability likely due to variations in storm track • HY event: cyclone track north of domain • PG event: cyclone track east of domain ja124521@albany.edu
Climatology: Frequency of Reports N = 28,872 N = 28,872 N = 27,644
Climatology: Frequency of Reports N = 27,751 Population 0.5° Barnes Analysis of spatial distribution of Population
Climatology: Frequency of Reports N = 27,751 Population Major Population area 0.5° Barnes Analysis of spatial distribution of Population
Climatology: Frequency of Reports N = 28,540 All 0.5° Barnes Analysis of spatial distribution of All wind reports
Climatology: Frequency of Reports N = 28,540 All Major Population area 0.5° Barnes Analysis of spatial distribution of All wind reports
Gradient Population Thunderstorm
Climatology: Frequency of Reports N = 16,907 Gradient 0.5° Barnes Analysis of spatial distribution of Gradient wind reports
Climatology: Frequency of Reports N = 16,907 Gradient Major Population area 0.5° Barnes Analysis of spatial distribution of Gradient wind reports
Climatology: Frequency of Reports N = 11,633 Thunderstorm 0.5° Barnes Analysis of spatial distribution of Thunderstorm wind reports
Climatology: Frequency of Reports N = 16,907 Thunderstorm Major Population area 0.5° Barnes Analysis of spatial distribution of Thunderstorm wind reports