Sound Analysis: Understanding Complex Stimuli and Waveform Dynamics in Hearing Science
This document explores the intricacies of complex sound stimuli and sound analysis as outlined in Chapters 4 and 5 of the Hearing Science textbook. It delves into essential formulas for sound pressure level calculations, the Fourier Theorem, waveforms, harmonic frequencies, amplitude and frequency modulation, and the impact of distance on sound levels. Key concepts include transient stimuli, spectral envelopes, and the comprehensive description of complex waves through time and frequency domains. The critical information aims to aid in understanding how complex sounds are perceived and analyzed.

Sound Analysis: Understanding Complex Stimuli and Waveform Dynamics in Hearing Science
E N D
Presentation Transcript
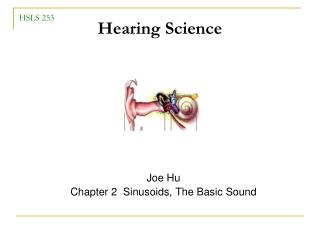
Hearing Science HSLS 253 Chapters 4 and 5 Complex Stimuli and Sound Analysis
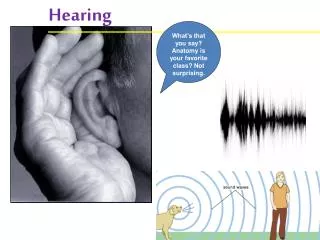
For each doubling of the distance, sound pressure level decreases by a factor of 2 How many dB is the difference between upper and lower waveforms?
Formulas you need to know by now. (Not all-inclusive) • D (t) = A sin (2 f t + ) • f = 1 / Pr • = c / f ( = c • Pr) I p2 1/r2 • dB = 20 log (p2 / p1)
Chapter 4 – Complex stimuli • Fourier Theorem • Spectrum • Fundamental frequency, harmonics, octaves • Tone bursts / transients (clicks) / square waves / • Beats • Amplitude modulation / frequency modulation • Noise – white, pink, and narrowband • Envelope and fine structure
FOURIER THEOREM: Any complex wave can be decomposed into a series of sine waves and vice versa. Joseph Fourier (1768-1830) Fourier analysis Time domain Frequency domain Inverse Fourier analysis
A sine wave Time domain Frequency domain Amplitude spectrum Phase spectrum
Time and frequency domains • Time and frequency domains are interchangeable • If we wish to ascertain the variation of a complex wave in time, we emphasize the waveform in the time domain. • If the frequency content of the complex wave is important, we emphasize the amplitude and phase spectra in the frequency domain. • When amplitude and phase spectra are described, the waveform has been completely defined. • In real life, most acoustic sounds are complex, i.e., consisting a sum of many sinusoids
Addition - Sinusoids can be added arithmetically. In-phase: when the phases of the two sine waves are the same Out-of-phase: when the phases are different.
A complex wave consisting of the sum of three sinusoids is generated by summing amplitudes for each point in time (e.g., a, b, c). Figure 4.2
Fundamental frequency Harmonics A complex wave consists of the sum of three sinusoids. Figure 4.1
A pulsed sinusoid has a continuous spectrum. Also called tone burst or short tone Figure 4.3
Line and continuous spectra • Line spectrum describes a complex wave consisting of a discrete number of sinusoids • For many line spectra, only integer multiples of the lowest frequency exist • Harmonic frequency vs. harmonics • Many complex sounds consist of a fundamental frequency and higher harmonics • Continuous spectrum describes a wave in which all frequencies (a continuum) between certain limits are present • Chalkboard illustration
Compare the quality of the different sounds! 1000-Hz sinusoid at different levels 100-Hz sinusoid with or without superimposed noise Complex waveforms (e.g., 100 + 200 + 300 Hz) Beats (80 + 85 Hz) use Sound Generator software
Duration Transient stimuli A transient stimulus has a broad continuous spectrum. • In this case, a single pulse • Amp = 10 V • Duration (D) = 1 ms • Zero amplitudes (nodes) occur at frequencies equal to integer multiples of 1/D Hz • In this case = 1/1ms = 1,000 Hz • Amplitude spectrum has non-zero amplitudes up to 1000 Hz • Phase spectrum is constant at 900 for all frequencies Figure 4.4
Transient stimuli • A single electric pulse drives the microphone diaphragm to vibrate and result in a transient sound, called a click • In this example, the diaphragm pushes outwards first, and therefore generates a condensation click. • What would happen if this is a rarefaction click? • Same amplitude spectrum • But, phase spectrum has 2700 starting phase at all frequencies Figure 4.4
A repeated transient stimulus has a broad spectrum with spectral components spaced 1/Pr apart. • Called a pulse train • Nodes at 1/D Hz and its integer multiples (1/1ms=1000 Hz) • Period (repetition rate) • Spacing b/w discrete frequency components = 1/Pr Hz (1/5ms=200 Hz) • With a the lowest frequency equals to the frequency at which the pulses is repeated Figure 4.5
Spectral Envelope • Fundamental frequency and harmonics • Spectral envelope • i.e., shape of the envelope is determined by duration (D) of the individual pulse • For example, pulses illustrated in Figures 4.4 and 4.5 have the same duration, therefore have the same spectral envelope • Phase spectrum is flat at 900 Figure 4.5
Beats Two complex sounds generated by summing two sinusoids (f1 and f2). (a): Large frequency separation (b): Small frequency separation Figure 4.6
Beats • When 2 sinusoids (A and B) with slightly different frequencies (fA and fB) are added together, the result is a sinusoid-like wave with frequency = (fA + fB) / 2 and the amplitude fluctuates (beats) at a frequency of fB – fA. • Perceived at a tone with a loudness that beats (a beating sensation) 80 Hz 85 Hz 80 + 85 Hz
SAM tones A sinusoidally amplitude modulated (SAM) sine wave has three spectral components. • The center frequency is equal to the carrier frequency (Fc) • The two side bands have frequencies of Fc+Fm and Fc-Fm • Fm: modulation frequency • The amplitudes of the two side band frequencies are A(m/2) • A: amplitude of Fc • m: modulation depth Figure 4.7
Frequency modulation • The frequency of the signal is changing over time Figure 4.9
Amplitude + frequency modulation • Amplitude and frequency of the signal both are changing over time Figure 4.11
Noise Noise: • a sound with an instantaneous amplitude that varies over time in a random manner Gaussian noise: • the instantaneous amplitude varies in its probability of occurrence according to the “normal”, or Gaussiandistribution. • The mean amplitude of Gaussian noise is zero • The higher or lower amplitude is less probably to occur at any moment in time Figure 4.13
White noise • all frequencies are present at the same intensity or pressure • Has a continuous and flat power spectrum • Occurred within certain frequency limits (bandwidth; BW) • Total noise power (TP) = sum of the amplitudes of the sinusoids • Spectrum level (N0) = average noise power level per unit bandwidth • N0 in dB = TP in dB – 10logBW • For example, a white noise has a total power of 80 dB SPL and a bandwidth of 1000 Hz (e.g., 500-1500 Hz), then • N0 = 80 – 10log1000 = 80 – 30 = 50 dB SPL Figure 4.14
Pink noise • For each doubling of frequency, the amplitude is halved • 3 dB roll-off for each doubling of frequency • The total power within any band of pink noise remains constant if the bandwidth of this band of pink noise is proportional to the center frequency of the noise band • For example, • A pink noise centered at 1000 Hz with a 500-Hz bandwidth would have the same total power as a band of pink noise centered at 2000 Hz with a 1000-Hz bandwidth { { { { { Figure 4.15
Narrowband noise • Contains limited number of frequency components • a) bandwidth= 10 Hz (500-510) • b) bandwidth= 25 Hz (500-525) • Temporal envelope: the slow overall amplitude change over time • The rate of the envelope fluctuation increases as the bandwidth of the noise increases • Fine structure: waveforms that fall underneath the temporal envelope Figure 4.16
Pure tone Tone burst Sawtooth Square wave Click Pulse train White noise SAM waveform spectrum
Complex Waves Fourier series and waves (animation) Animation courtesy of Dr. Dan Russell, Kettering University
Problems for chapter 4 What is Fourier’s theorem? What are beats? What is Gaussian noise?
frequency (Hz) frequency Hz) Problems for chapter 4 (15 min classroom activity) Draw a time domain (2 cycles) and frequency domain descriptions of a 500-Hz sinusoid with a baseline-to-peak amplitude of 10 v and a starting phase of 270° Draw a time domain waveforms (3 cycles) for the frequency domain description shown below:
Chapter 5 – Sound Analysis Harmonics and octaves Resonators and resonant frequency Filters (lowpass, highpass, bandpass, bandreject, cutoff) Nonlinearities and distortion
Harmonic and octave relations of a 1000-Hz tone • Harmonics: integer multiples of the fundamental frequency • Octaves: each doubling of frequency
Resonant frequency • The natural vibratory frequency of an object • Determined by its characteristic impedance (Zc) • fr sqrt(s/m) • s: stiffness, m: mass • Resonator – the object that resonates. The pendulum example, a classroom table, guitar strings, vocal cords, etc. Figure 2.2
It is easier for a driving force to vibrate an object if the driving force has a frequency closer to the natural vibratory frequency of the object • A maximal amount of amplitude transfer will occur when the frequency of the driving force is equal to the resonant frequency of the vibrating object • Maximal resonant amplitude occurs at 200 Hz • it is likely that the resonant frequency of this object equals 200 Hz • With little resistance, the peak will be sharper Figure 5-1
Filters A filter is a resonator that is especially designed to determine or to modify the frequency of a vibrating object. Such resonator is called a filter. The pendulum example Electronics (resistors/capacitors) Digital signal processing
Four types of filters Low Pass High Pass Band Pass Band Reject • Cutoff frequency (Hz) • Roll-off (slope) (dB/octave) relative to the cutoff frequency of the filter • Attenuation roll-off in dB per octave Figure 5.2
The outputs of four narrow, band pass filters can be used to estimate the amplitude spectrum of a sound. • Can use a series of bandpass filters to estimate the spectral components of a waveform. Figure 5.3
Shaping the spectrum of a signal • The amplitude spectrum of an input can be modified (shaped) by a filter. • An object that has mass and is moved by a driving force can act as a filter. Figure 5.4
As the frequency spectrum is modified, the time-domain waveform is also changed by the filter. • Mass requires time to move. • For example, the cone in a loudspeaker. • Another example – eardrum • Speaker cone and eardrum act like low-pass filters Figure 5.5
F1= 166.7 Hz A1= 1 F2= 500 Hz A2= 1 F1+F2 Fig. 5.5a
F1= 166.7 Hz A1= 1 F2= 500 Hz A2= 1/4 F1+F2 Fig. 5.5c
Nonlinearity and distortion • A linearsystem: the sinusoid input signal may be changed only in phase or amplitude, but not frequency. • f1, f2 f1, f2 • A nonlinear system: frequencies are present in the output signal that are not present in the input signal. • f1, f2 f1, f2, harmonics, combination tones, etc
A nonlinear device results in a distortion in the time waveform. • A morphology change in time waveform may result from a filter or a nonlinear device. Figure 5.6
y x • A linearsystem: • y = ax + b • A nonlinear system: • y= ax + bx2 + cx3 + dx4 + etc. • The presence of the terms of with a power greater than one (e.g., x2) produces harmonics and combination tones
Amplitude 2f1-f2 f1 f2 frequency (Hz) Cubic distortion product • Our auditory system is nonlinear. • e.g., hair cells yield otoacoustic emissions (OAEs) • Cubic distortion product = 2f1 – f2.
Problems for Chapter 5 (15 min in class activity) Draw the filter shape of a bandpass filter that has cutoff frequencies of 1000 and 2000 Hz and a slope (roll-off) of 10 dB/octave. What are the 2nd and 5th harmonics and 2nd and 5th octaves of 100 Hz? When 2 tones (f1 and f2) are delivered to the inner ear, a cubic difference tone (i.e., 2f1-f2) is generated. Given that, is the inner ear considered a linear or nonlinear system? The head shadow effect reduces the amplitude of a 4000-Hz tone in the opposite ear. Is this effect considered linear or nonlinear? What type of filter is used to change the upper waveform to the lower waveform? What is resonant frequency (fr)? What can you tell about the relationship between fr and mass? given that fr sqrt(s/m), where s and m are stiffness and mass, respectively?