Download
1 / 28
280 likes | 438 Views
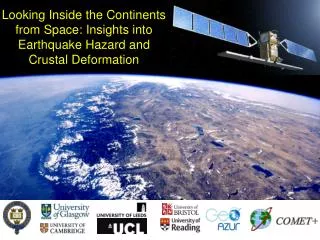
Looking Inside the Continents from Space: Insights into Earthquake Hazard and Crustal Deformation. S. N. India. Tibetan Plateau. 5 cm/yr. S. N. Earthquake Hazard in the Alpine-Himalayan Belt. Alpine-Himalayan Belt. 75% of earthquakes killing more than 10k since 1900.

E N D
Looking Inside the Continents from Space: Insights into Earthquake Hazard and Crustal Deformation S N
India Tibetan Plateau 5 cm/yr S N
Earthquake Hazard in the Alpine-Himalayan Belt Alpine-Himalayan Belt 75% of earthquakes killing more than 10k since 1900.
Mapping Surface Deformation (Strain) mm/yr North Anatolian Fault, 23 mm/yr 6 • Although they can not be predicted, earthquakes are preceded by the slow build up of tectonic strain. • Repeated satellite radar measurement can be combined to measure surface displacements at the mm level over large areas. • The team have pioneered methods for mapping deformation using satellite radar. • A radical increase in radar data quality and quantity from the Sentinel-1 mission will allow strain to be mapped with high accuracy over large regions for the first time. 0 -6 Wright, Parsons & Fielding, GRL 2001
Objectives B: Improve seismic hazard assessment A: Make fundamental advance in the mapping of tectonic deformation (for Alpine-Himalayan Belt and East African Rift) C: Understand how the continents deform in space and time
Basic Question 1: What is the Mechanical Structure of Fault Zones Controlling the Earthquake Cycle cm 4 LOS displacement (cm) ~20 mm/yr 0 Poro-elasticity Afterslip -4 Visco-elastic relaxation Postseismic, 1997 Manyi Earthquake Ryder, Parsons, Wright & Funning, GJI, 2007
Basic Question 1: What is the Mechanical Structure of Fault Zones Controlling the Earthquake Cycle Poro-elasticity Afterslip Earthquakes with Mw ≥ 6.7. Black: 1991-2012 (InSAR era); Red: 1978-1991 Visco-elastic relaxation • Modelling the earthquake cycle has been hampered by the lack of observations (relatively few events where data available + short time periods compared to length of cycle) • We will build and test dynamical models of the earthquake cycle, constrained by observations of different parts of faults at different stages in the cycle
Basic Question 2: What is the Mechanical Structure of Continental Lithosphere? Horizontal a y Red = weak lower crust Black = strong lower crust x a b b Vertical Copley, 2008
Accuracy Requirements and Earthquake Hazard Cumulative percentage of earthquake deaths Magnitude of tectonic strain (x10-9 /yr) • 96% of all earthquake deaths are in regions with strain rates greater than 1mm/yr over 100 km (10-8/yr) • 77% of fatalities occur where deformation rates are ≤ 5 mm/yr over 100 km.
Achieving 1 mm/yr accuracy mm/yr 5 Accurate Orbital Models 0 -5 Atmospheric Corrections Wang, Wright et al, 2008
Achieving 1 mm/yr accuracy mm/yr Error for mission with 12-day repeat 5 0 -5 Length scale of observation (km) Duration of time series (years) Wang, Wright et al, 2008
Producing High-resolution Velocity and Strain Fields from InSAR and GPS East Velocity Strain Wang & Wright, GRL2012
Identifying previously unknown faults with high-resolution imagery and DEMs Lepsy fault + + + + + + SRTM Digital elevation data N 10 km Lepsy fault, Kazakhstan (Walker, Jackson et al, in preparation) Richard Walker, pers comm 10 m Single event? Length 100 km, slip 10 m .....Magnitude 8.0 17/11/12
The Team Tectonic Deformation A1: InSAR Time Series [Leeds: Wright, Hooper, PDRA #1] A2: Atmospheric Errors [Glasgow: Li, PDRA #2; Reading: Wadge] A3: Orbital Errors [UCL: Ziebart, PDRA #3] Seismic Hazard B4: Strain/Hazard Mapping [Leeds: Wright, Walters (COMET+ PDRA #4)] B5: Finding Faults [Oxford: Walker, PDRA #5; Cambridge: Jackson] B6: Time-dependent Hazard [Oxford: England, Elliott (COMET+ PDRA #6), Parsons] Modelling C7: Earthquake Cycle Models [Oxford: Parsons, PDRA #7; Leeds: Houseman, Wright] C8: 3D Numerical Modelling [Cambridge: Copley; Leeds: Houseman; Oxford: England] C9: East African Rift [Bristol: Biggs; Reading: Wadge] Wright Parsons Plus 5 PhD students, Partner Nocquet (GPS) Impact Partners
Why us? Why now? • Ambitious, Frontier Science • Velocity and strain fields and resultant models will transform our understanding of continental deformation. • Timely • Exploits radical increase in SAR data from the Sentinel-1 mission, an opportunity for leadership in this field. • Achievable • Builds on more than a decade of development by the investigators. • Societal Impact • Accurate knowledge of the distribution of seismic hazard is the first step in hazard mitigation.
What this project will deliver Precise Orbits for Sentinel-1 Data High-resolution deformation measurements from Sentinel-1 Fault Map for Alpine-Himalayan Belt Water Vapour measurements Earthquake source models Regional Strain Maps Derived products Earthquake Cycle Deformation Models 3D Models of Continental Tectonics Models Earthquake Hazard Information
Q. Can we be confident of achieving 1cm orbital precision? Sentinel-1 • Technical challenges: • Solar and Earth radiation photon pressure modelling • Atmospheric drag • Antenna thrust (recoil forces from signal transmission) • GPS phase centre determination/multipath modelling • Orbit product validation (laser ranging residual analysis, repeatability) Jason-1 JPL/UCL orbit (1cm accuracy) 5cm error True trajectory Biased orbit (mismodelled dynamics)
Q. How well can we remove atmospheric noise? Jolivet et al., 2011 We assume, conservatively, that weather models will correct 50% of single interferograms
Q. Can we really estimate water vapour in near-real time? For N=15, error in path delay ~ 2 mm; For N=100 (~3 years), error ~1 mm
Q. Will it be coherent at C-band? C-band coherence (1 year = red; 1 cycle = red+orange) L-band should be coherence in most places over 13 days Wright et al., Fringe 2011
Q. Why East Africa? Lithospheric thickness Shear-wave anomaly (75 km) Hammond et al., 2013 Craig, Jackson et al., 2011
Q. How much better than existing missions? Envisat Data, 70 Day Repeat, 7 years data 40% of areas straining above 10-8 yr-1 Sentinel-1A Data, 12 Day Repeat, 3 years data 80% of areas straining above 10-8 yr-1 [90 % with two satellites] Wright et al., Fringe 2011
Q. How to turn strain into hazard maps? Number of earthquakes forecast with M > 5.66, from Bird et al., 2010. Green = 1 earthquake per century in a 100 x 100 km area . [Crude because strain data is low resolution]
Q. Time dependent Hazard? New Zealand Earthquakes 2010-11 3 September 2010: Darfield, M7.1 21 February 2011: Christchurch, M6.3